파일:Ceres Orbit.svg

SVG 파일의 PNG 형식의 미리보기 크기: 742 × 563 픽셀. 다른 해상도: 316 × 240 픽셀 | 633 × 480 픽셀 | 1,012 × 768 픽셀 | 1,280 × 971 픽셀 | 2,560 × 1,942 픽셀
원본 파일 (SVG 파일, 실제 크기 742 × 563 픽셀, 파일 크기: 21 KB)
파일 설명
| 설명 |
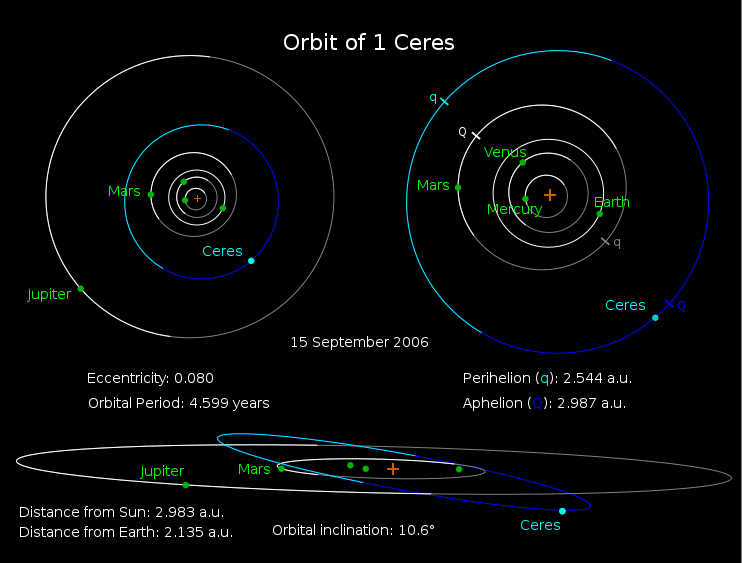
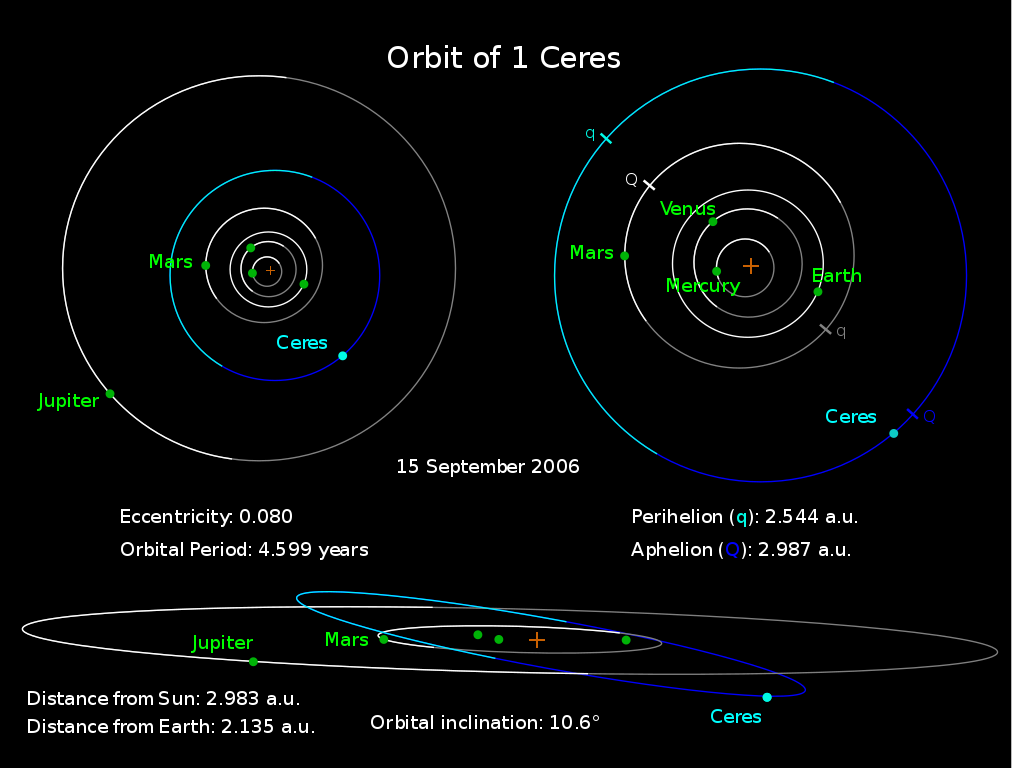
English: The diagram illustrates the orbits of Ceres (blue) and several planets (white/grey). The segments of orbits below the ecliptic are plotted in darker colours, and the orange plus sign is the Sun's location. The top left diagram is a polar view that shows the location of Ceres in the gap between Mars and Jupiter. The top right is a close-up demonstrating the locations of the perihelia (q) and aphelia (Q) of Ceres and Mars. Interestingly, the perihelia of Ceres (as well as those of several other of the largest MBAs) and Mars are on the opposite sides of the Sun. The bottom diagram is a perspective view showing the inclination of the orbit of Ceres compared to the orbits of Mars and Jupiter.
Deutsch: Das Diagramm illustriert die Umlaufbahnen der Ceres (blau) und mehrerer Planeten (weiß/grau). Die Abschnitte der Umlaufbahnen unter der Ekliptik sind in dunkleren Farben dargestellt und die orangenen Plus-Zeichen bezeichnen die Position der Sonne. Das Diagramm links oben ist eine polare Sicht der Periapsis, die die Position der Ceres in der Lücke zwischen Mars und Jupiter zeigt. Das Diagramm rechts oben ist eine Nahaufnahme, die die Positionen der Periapsis (q) und der Apoapsis (Q) der Ceres und des Mars zeigen. Interessanterweise ist die Periapsis der Ceres (wie auch die mehrerer anderer der größten MBAs) und des Mars auf der gegenüberliegenden Seite der Sonne. Das untere Diagramm ist eine perspektivische Sicht, die die Inklination der Umlaufbahn der Ceres mit den Umlaufbahnen des Mars und des Jupiter vergleicht.
Français : Ce schéma montre les orbites de la planète naine (1) Cérès (bleu) et de certaines autres planètes du système solaire (vert et gris). La partie de chaque orbite située sous le plan de l'écliptique est affichée d'une couleur plus sombre ; la croix orange représente la position du Soleil. |
| 날짜 | |
| 출처 | Based on data obtained from NASA, here |
| 저자 | User: Orionist |
| 다른 버전 |
|
.svg)


.svg)


|
이 SVG 파일은 편집 가능한 문자를 사용하므로 Inkscape나 Adobe Illustrator를 사용하여 쉽게 다른 언어로 번역할 수 있습니다. 여기를 참고하세요. 또한 텍스트 편집기를 이용하여 수동으로 파일을 번역할 수도 있습니다. |
라이선스
나는 아래 작품의 저작권자로서, 이 저작물을 다음과 같은 라이선스로 배포합니다:

|
GNU 자유 문서 사용 허가서 1.2판 또는 자유 소프트웨어 재단에서 발행한 이후 판의 규정에 따라 본 문서를 복제하거나 개작 및 배포할 수 있습니다. 본 문서에는 변경 불가 부분이 없으며, 앞 표지 구절과 뒷 표지 구절도 없습니다. 본 사용 허가서의 전체 내용은 GNU 자유 문서 사용 허가서 부분에 포함되어 있습니다. |
| 이 파일은 크리에이티브 커먼즈 저작자표시-동일조건변경허락 3.0 Unported 라이선스로 배포됩니다. | ||
| ||
| 이 라이선스 틀은 GFDL 라이선스 변경의 일부로 이 파일에 추가되었습니다. |
- 이용자는 다음의 권리를 갖습니다:
- 공유 및 이용 – 저작물의 복제, 배포, 전시, 공연 및 공중송신
- 재창작 – 저작물의 개작, 수정, 2차적저작물 창작
- 다음과 같은 조건을 따라야 합니다:
- 저작자표시 – 적절한 저작자 표시를 제공하고, 라이센스에 대한 링크를 제공하고, 변경사항이 있는지를 표시해야 합니다. 당신은 합리적인 방식으로 표시할 수 있지만, 어떤 방식으로든 사용권 허가자가 당신 또는 당신의 사용을 지지하는 방식으로 표시할 수 없습니다.
- 동일조건변경허락 – 만약 당신이 이 저작물을 리믹스 또는 변형하거나 이 저작물을 기반으로 제작하는 경우, 당신은 당신의 기여물을 원저작물과 동일하거나 호환 가능한 라이선스에 따라 배포하여야 합니다.
이 라이선스 중에서 목적에 맞는 것을 선택하여 사용할 수 있습니다.
파일 역사
날짜/시간 링크를 클릭하면 해당 시간의 파일을 볼 수 있습니다.
| 날짜/시간 | 섬네일 | 크기 | 사용자 | 설명 | |
|---|---|---|---|---|---|
| 현재 | 2015년 3월 7일 (토) 03:27 | | 742 × 563 (21 KB) | Caesar | Fixed an issue with text that had become outlined ("Perihelion" and "Aphelion"). |
| 2011년 9월 10일 (토) 01:10 |  | 742 × 563 (50 KB) | ANGELUS | fixed | |
| 2009년 11월 13일 (금) 05:41 |  | 742 × 563 (22 KB) | Sebastian Wallroth | text objects transformed | |
| 2006년 11월 6일 (월) 14:27 |  | 742 × 563 (38 KB) | Orionist | {{Information |Description= The diagram illustrates the orbits of Ceres (blue) and several planets (white/grey). The segments of orbits below the ecliptic are plotted in darker colours, and the orange plus sign is the Sun's location. The top left diagram | |
| 2006년 11월 6일 (월) 13:47 |  | 742 × 563 (38 KB) | Orionist | == Summary == {{Information |Description= The diagram illustrates the orbits of Ceres (blue) and several planets (white/grey). The segments of orbits below the ecliptic are plotted in darker colours, and the orange plus sign is the Sun's location. The top |
이 파일을 사용하는 문서
다음 문서 1개가 이 파일을 사용하고 있습니다:
이 파일을 사용하고 있는 모든 위키의 문서 목록
다음 위키에서 이 파일을 사용하고 있습니다:
- ce.wikipedia.org에서 이 파일을 사용하고 있는 문서 목록
- cs.wikipedia.org에서 이 파일을 사용하고 있는 문서 목록
- da.wikipedia.org에서 이 파일을 사용하고 있는 문서 목록
- en.wikipedia.org에서 이 파일을 사용하고 있는 문서 목록
- en.wikiversity.org에서 이 파일을 사용하고 있는 문서 목록
- es.wikipedia.org에서 이 파일을 사용하고 있는 문서 목록
- eu.wikipedia.org에서 이 파일을 사용하고 있는 문서 목록
- fa.wikipedia.org에서 이 파일을 사용하고 있는 문서 목록
- fi.wikipedia.org에서 이 파일을 사용하고 있는 문서 목록
- fr.wikipedia.org에서 이 파일을 사용하고 있는 문서 목록
- id.wikipedia.org에서 이 파일을 사용하고 있는 문서 목록
- it.wikipedia.org에서 이 파일을 사용하고 있는 문서 목록
- ja.wikipedia.org에서 이 파일을 사용하고 있는 문서 목록
- lfn.wikipedia.org에서 이 파일을 사용하고 있는 문서 목록
- nl.wikipedia.org에서 이 파일을 사용하고 있는 문서 목록
- no.wikipedia.org에서 이 파일을 사용하고 있는 문서 목록
- pl.wikipedia.org에서 이 파일을 사용하고 있는 문서 목록
- pt.wikipedia.org에서 이 파일을 사용하고 있는 문서 목록
- ro.wikipedia.org에서 이 파일을 사용하고 있는 문서 목록
- te.wikipedia.org에서 이 파일을 사용하고 있는 문서 목록
- tt.wikipedia.org에서 이 파일을 사용하고 있는 문서 목록
- www.wikidata.org에서 이 파일을 사용하고 있는 문서 목록
- zh.wikipedia.org에서 이 파일을 사용하고 있는 문서 목록