파일:Navier Stokes Laminar.svg

원본 파일(SVG 파일, 실제 크기 900 × 720 픽셀, 파일 크기: 9.37 MB)

파일 설명

설명
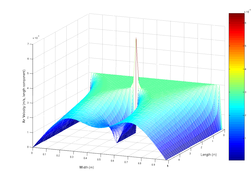
English: SVG illustration of the classic Navier-Stokes obstructed duct problem, which is stated as follows. There is air flowing in the 2-dimensional rectangular duct. In the middle of the duct, there is a point obstructing the flow. We may leverage Navier-Stokes equation to simulate the air velocity at each point within the duct. This plot gives the air velocity component of the direction along the duct. One may refer to [1], in which Eq. (3) is a little simplified version compared with ours.
날짜
출처

자작

Brief description of the numerical method

The following code leverages some numerical methods to simulate the solution of the 2-dimensional Navier-Stokes equation.

We choose the simplified incompressible flow Navier-Stokes Equation as follows:

The iterations here are based on the velocity change rate, which is given by

Or in X coordinates:

The above equation gives the code. The case of Y is similar.
저자 IkamusumeFan
다른 버전
SVG 발전
InfoField
 
SVG 파일의 소스 코드 문법이 올바릅니다.
 
벡터 그림Matplotlib(으)로 제작되었습니다.
소스 코드
InfoField

Python code

from __future__ import division
from numpy import arange, meshgrid, sqrt, zeros, sum
import matplotlib.pyplot as plt
from mpl_toolkits.mplot3d import Axes3D
from matplotlib.ticker import ScalarFormatter
from matplotlib import rcParams
 
rcParams['font.family'] = 'serif'
rcParams['font.size'] = 16 

# the layout of the duct laminar
x_max = 5 # duct length
y_max = 1 # duct width

# draw the frames, including the angles and labels
ax = Axes3D(plt.figure(figsize=(10, 8)), azim=20, elev=20)
ax.set_xlabel(r"$x$", fontsize=20)
ax.set_ylabel(r"$y$", fontsize=20)
ax.zaxis.set_rotate_label(False)
ax.set_zlabel(r"$v_x$", fontsize=20, rotation='horizontal')
formatter = ScalarFormatter(useMathText=True)
formatter = ScalarFormatter()
formatter.set_scientific(True)
formatter.set_powerlimits((-2,2))
ax.w_zaxis.set_major_formatter(formatter)
ax.set_xlim([0, x_max])
ax.set_ylim([0, y_max])

# initial speed of the air
ini_v = 3e-3
mu = 1e-5
rho = 1.3

# the acceptable difference when termination
accept_diff = 1e-5
# time interval
time_delta = 1.0
# coordinate interval
delta = 1e-2;
X = arange(0, x_max + delta, delta)
Y = arange(0, y_max + delta, delta)
# number of coordinate points
x_size = len(X) - 1
y_size = len(Y) - 1
Vx = zeros((len(X), len(Y)))
Vy = zeros((len(X), len(Y)))
new_Vx = zeros((len(X), len(Y)))
new_Vy = zeros((len(X), len(Y)))

# initial conditions
Vx[1: x_size - 1, 2:y_size - 1] = ini_v


# start evolution and computation
res = 1 + accept_diff
rounds = 0
alpha = mu/(rho * delta**2)
while (res>accept_diff and rounds<100):
    """
    The iterations here are based on the velocity change rate, which
    is given by
    
    \frac{\partial v}{\partial t} = \alpha\nabla^2 v - v \cdot \nabla v
    
    with \alpha = \mu/\rho.
    """
    new_Vx[2:-2, 2:-2] = Vx[2:-2, 2:-2] +  time_delta*(alpha*(Vx[3:-1, 2:-2] +
        Vx[2:-2, 3:-1] - 4*Vx[2:-2, 2:-2] + Vx[2:-2, 1:-3] + Vx[1:-3, 2:-2]) -
        0.5/delta * (Vx[2:-2, 2:-2] * (Vx[3:-1, 2:-2] - Vx[1:-3, 2:-2]) +
        Vy[2:-2, 2:-2]*(Vx[2:-2, 3:-1] - Vx[2:-2, 1:-3])))

    new_Vy[2:-2, 2:-2] = Vy[2:-2, 2:-2] + time_delta*(alpha*(Vy[3:-1, 2:-2] +
        Vy[2:-2, 3:-1] - 4*Vy[2:-2, 2:-2] + Vy[2:-2, 1:-3] + Vy[1:-3, 2:-2]) -
        0.5/delta * (Vy[2:-2, 2:-2] * (Vy[2:-2, 3:-1] - Vy[2:-2, 3:-1]) +
        Vx[2:-2, 2:-2]*(Vy[3:-1, 2:-2] - Vy[1:-3, 2:-2])))
        
    rounds = rounds + 1
    
    # copy the new values
    Vx[2:-2, 2:-2] = new_Vx[2:-2, 2:-2]
    Vy[2:-2, 2:-2] = new_Vy[2:-2, 2:-2]


    # set free boundary conditions: dv_x/dx = dv_y/dx = 0.
    Vx[-1, 1:-1] = Vx[-3, 1:-1]
    Vx[-2, 1:-1] = Vx[-3, 1:-1]
    Vy[-1, 1:-1] = Vy[-3, 1:-1]
    Vy[-2, 1:-1] = Vy[-3, 1:-1]

    # there exists a still object in the plane
    Vx[x_size//3:x_size//1.5, y_size//2.0] = 0
    Vy[x_size//3:x_size//1.5, y_size//2.0] = 0

    # calculate the residual of Vx
    res = (Vx[3:-1, 2:-2] + Vx[2:-2, 3:-1] -
           Vx[1:-3, 2:-2] - Vx[2:-2, 1:-3])**2
    res = sum(res)/(4 * delta**2 * x_size * y_size)

# prepare the plot data
Z = sqrt(Vx**2)

# refine the region boundary
Z[0, 1:-2] = Z[1, 1:-2]
Z[-2, 1:-2] = Z[-3, 1:-2]
Z[-1, 1:-2] = Z[-3, 1:-2]

Y, X = meshgrid(Y, X);
ax.plot_surface(X, Y, Z, rstride=1, cstride=1, cmap="summer", lw=0.1,
                edgecolors="k")
plt.savefig("Navier_Stokes_Laminar.svg")

라이선스

나는 아래 작품의 저작권자로서, 이 저작물을 다음과 같은 라이선스로 배포합니다:
w:ko:크리에이티브 커먼즈
저작자표시 동일조건변경허락
이용자는 다음의 권리를 갖습니다:
  • 공유 및 이용 – 저작물의 복제, 배포, 전시, 공연 및 공중송신
  • 재창작 – 저작물의 개작, 수정, 2차적저작물 창작
다음과 같은 조건을 따라야 합니다:
  • 저작자표시 – 적절한 저작자 표시를 제공하고, 라이센스에 대한 링크를 제공하고, 변경사항이 있는지를 표시해야 합니다. 당신은 합리적인 방식으로 표시할 수 있지만, 어떤 방식으로든 사용권 허가자가 당신 또는 당신의 사용을 지지하는 방식으로 표시할 수 없습니다.
  • 동일조건변경허락 – 만약 당신이 이 저작물을 리믹스 또는 변형하거나 이 저작물을 기반으로 제작하는 경우, 당신은 당신의 기여물을 원저작물과 동일하거나 호환 가능한 라이선스에 따라 배포하여야 합니다.
  1. Fan, Chien, and Bei-Tse Chao. "Unsteady, laminar, incompressible flow through rectangular ducts." Zeitschrift für angewandte Mathematik und Physik ZAMP 16, no. 3 (1965): 351-360.

설명

이 파일이 나타내는 바에 대한 한 줄 설명을 추가합니다
project

이 파일에 묘사된 항목

다음을 묘사함

파일 역사

날짜/시간 링크를 클릭하면 해당 시간의 파일을 볼 수 있습니다.

날짜/시간섬네일크기사용자설명
현재2016년 3월 15일 (화) 10:062016년 3월 15일 (화) 10:06 판의 섬네일900 × 720 (9.37 MB)NicoguaroSmaller version
2016년 3월 15일 (화) 09:582016년 3월 15일 (화) 09:58 판의 섬네일900 × 720 (11.08 MB)NicoguaroChange the jet colormap, since it is recognized as a bad option, in general. Formatting, and pythonic code (and vectorized operations).
2014년 11월 7일 (금) 08:342014년 11월 7일 (금) 08:34 판의 섬네일720 × 540 (14.23 MB)IkamusumeFanUser created page with UploadWizard

이 파일을 사용하고 있는 모든 위키의 문서 목록

다음 위키에서 이 파일을 사용하고 있습니다:

이 파일의 더 많은 사용 내역을 봅니다.

메타데이터