파일:Physical Drivers of climate change.svg

SVG 파일의 PNG 형식의 미리보기 크기: 645 × 600 픽셀. 다른 해상도: 258 × 240 픽셀 | 516 × 480 픽셀 | 826 × 768 픽셀 | 1,101 × 1,024 픽셀 | 2,202 × 2,048 픽셀 | 960 × 893 픽셀
원본 파일 (SVG 파일, 실제 크기 960 × 893 픽셀, 파일 크기: 33 KB)
이 파일은 SVG <switch> 요소를 사용하여 번역되었습니다. 모든 번역들은 같은 파일에 저장됩니다! 여기를 참고하세요.
번역이 완료된 당신의 언어에서 이 파일을 이용할 때에는 언어 코드와 To translate the text into your language, you can use the SVG Translate tool. Alternatively, you can download the file to your computer, add your translations using whatever software you're familiar with, and re-upload it with the same name. You will find help in Graphics Lab if you're not sure how to do this. |
파일 설명
| 설명 |
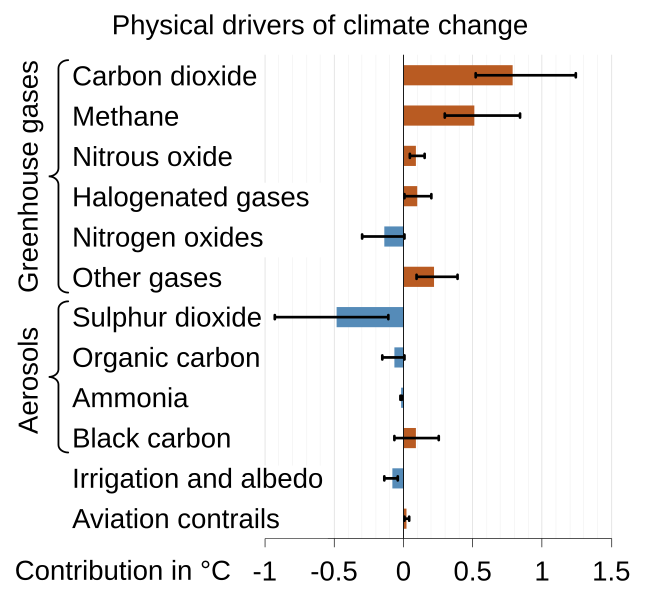
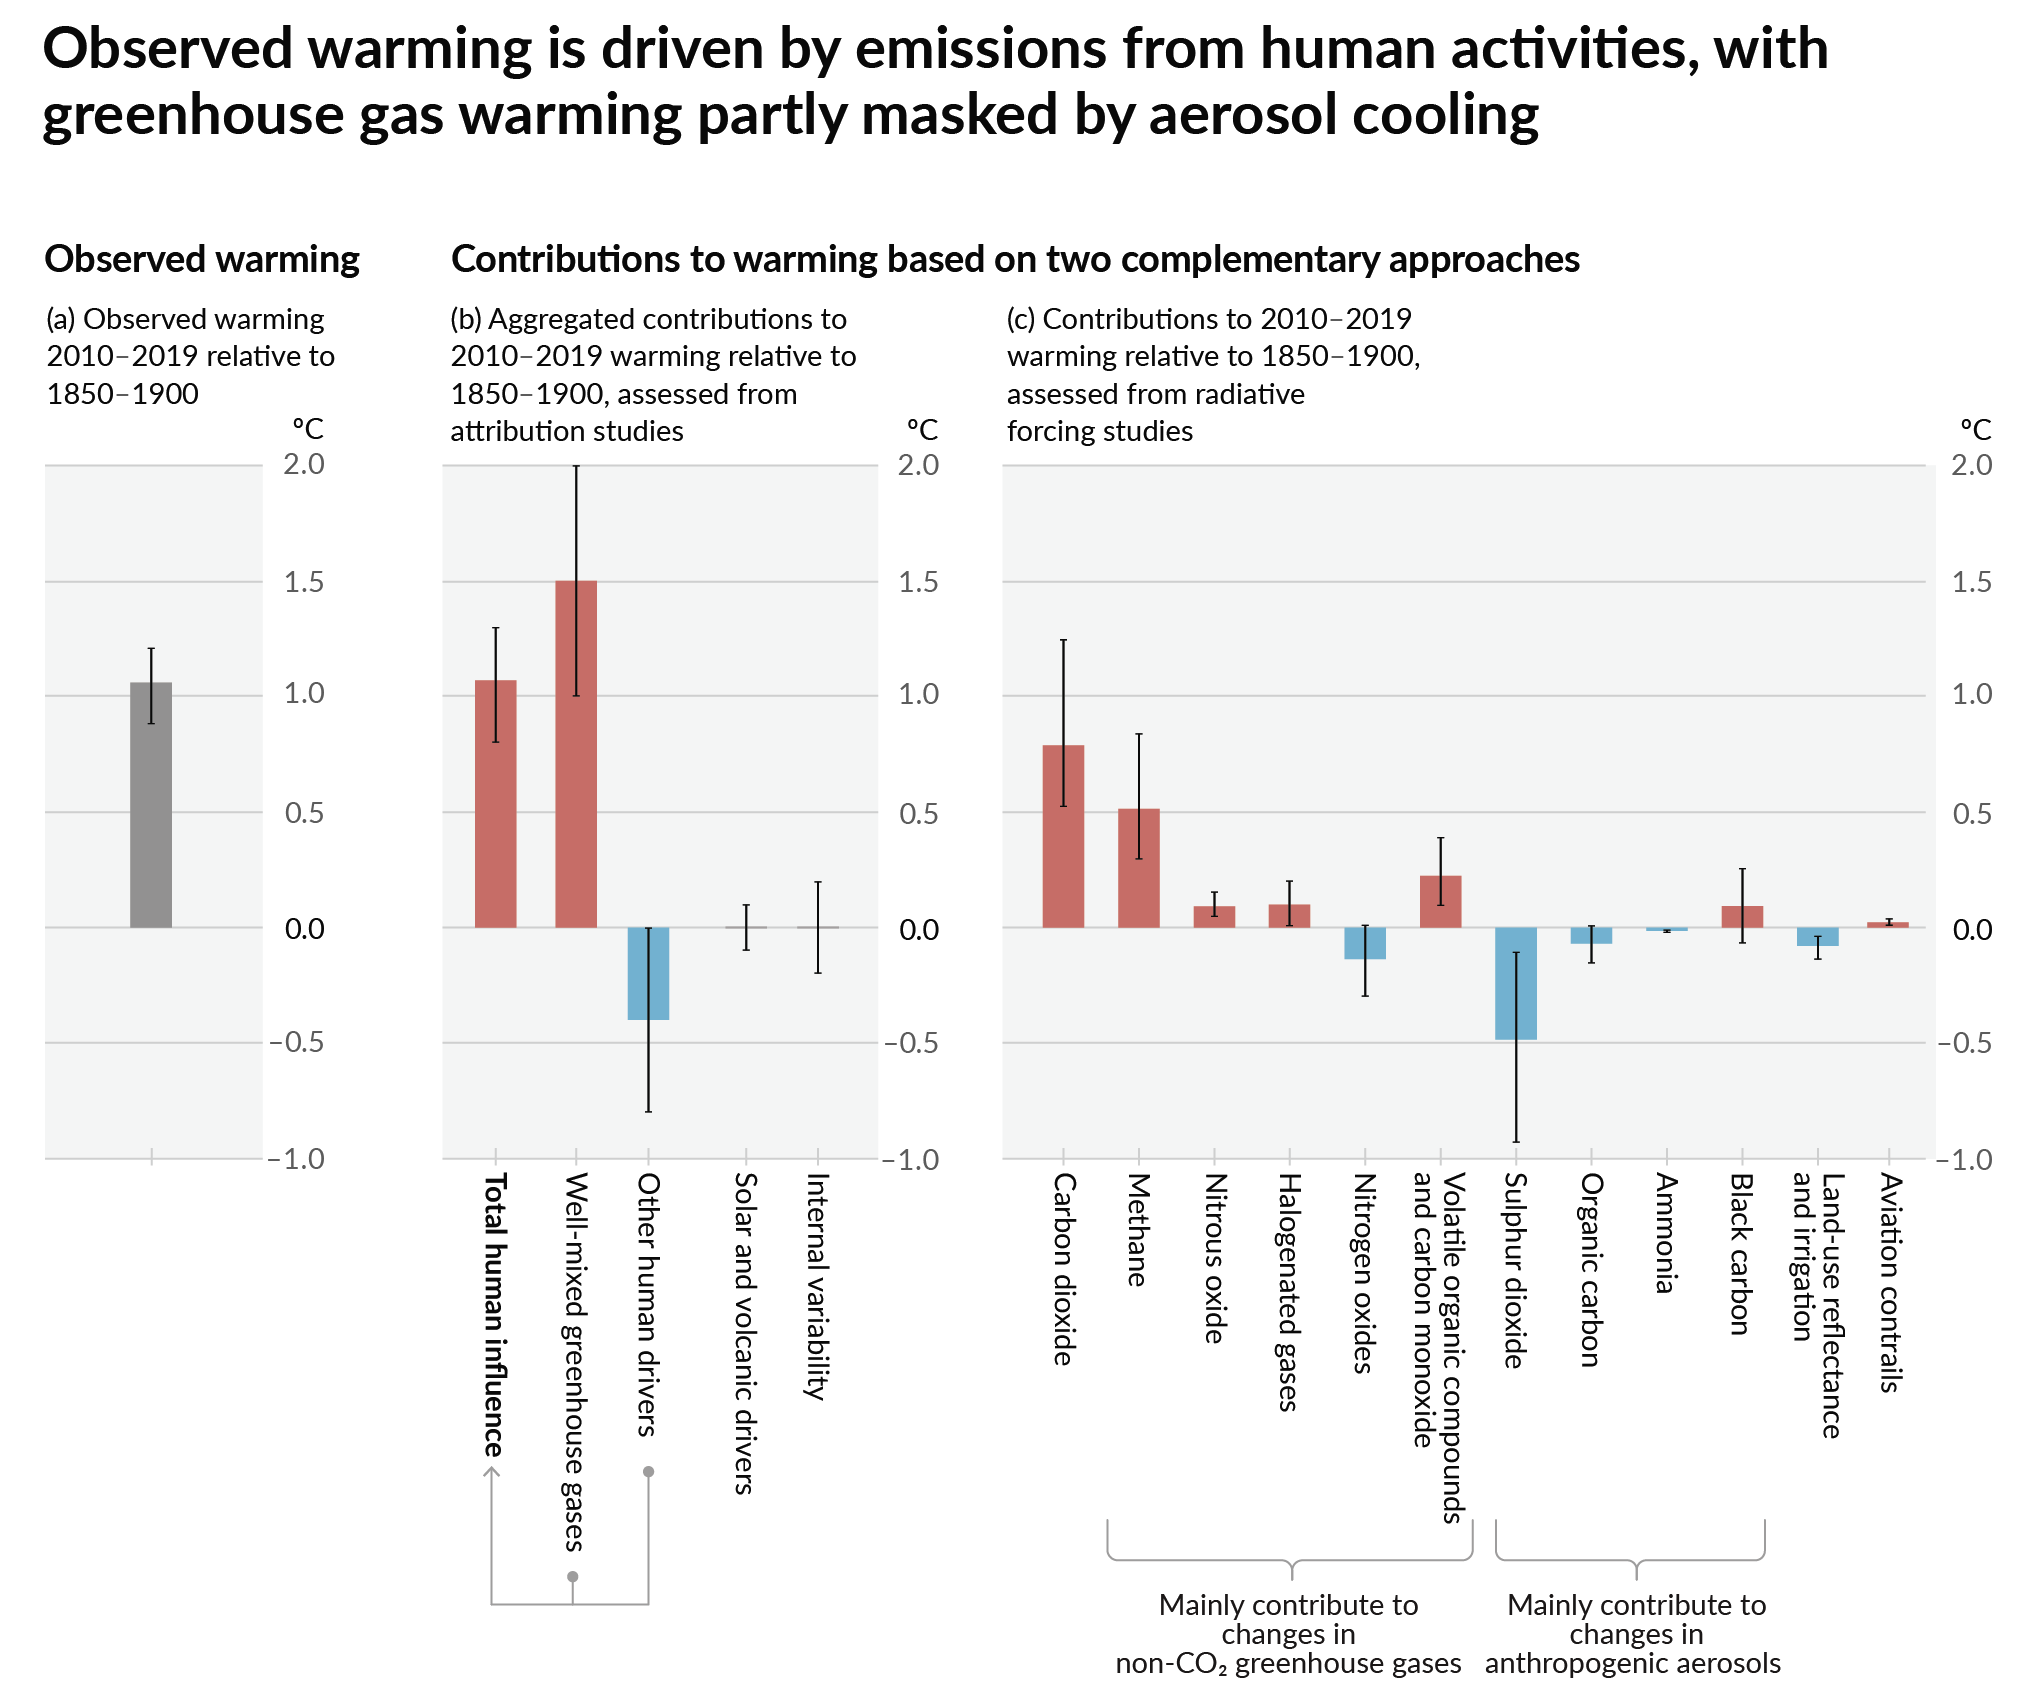
English: Contribution to observed climate change from 12 different drivers, as taken from the Summary for Policymakers of the sixth IPCC assessment report, adapted from figure SPM.2c.
|
| 날짜 | |
| 출처 | 자작 |
| 저자 | Eric Fisk |
| 다른 버전 |
File:Physical Drivers of climate change.svg has 2 embedded translations.
|


라이선스
나는 아래 작품의 저작권자로서, 이 저작물을 다음과 같은 라이선스로 배포합니다:
이 파일은 크리에이티브 커먼즈 저작자표시-동일조건변경허락 4.0 국제 라이선스로 배포됩니다.
- 이용자는 다음의 권리를 갖습니다:
- 공유 및 이용 – 저작물의 복제, 배포, 전시, 공연 및 공중송신
- 재창작 – 저작물의 개작, 수정, 2차적저작물 창작
- 다음과 같은 조건을 따라야 합니다:
- 저작자표시 – 적절한 저작자 표시를 제공하고, 라이센스에 대한 링크를 제공하고, 변경사항이 있는지를 표시해야 합니다. 당신은 합리적인 방식으로 표시할 수 있지만, 어떤 방식으로든 사용권 허가자가 당신 또는 당신의 사용을 지지하는 방식으로 표시할 수 없습니다.
- 동일조건변경허락 – 만약 당신이 이 저작물을 리믹스 또는 변형하거나 이 저작물을 기반으로 제작하는 경우, 당신은 당신의 기여물을 원저작물과 동일하거나 호환 가능한 라이선스에 따라 배포하여야 합니다.
파일 역사
날짜/시간 링크를 클릭하면 해당 시간의 파일을 볼 수 있습니다.
| 날짜/시간 | 섬네일 | 크기 | 사용자 | 설명 | |
|---|---|---|---|---|---|
| 현재 | 2024년 3월 10일 (일) 18:03 | | 960 × 893 (33 KB) | Hakimi97 | File uploaded using svgtranslate tool (https://svgtranslate.toolforge.org/). Added translation for ms. |
| 2022년 11월 19일 (토) 06:06 |  | 960 × 893 (30 KB) | Efbrazil | Renamed "Land-use changes" to "Irrigation and albedo", as land use changes contributing to CO2 emissions are not included in the bar (they are in the CO2 bar) | |
| 2022년 9월 30일 (금) 15:36 |  | 960 × 893 (30 KB) | আজিজ | File uploaded using svgtranslate tool (https://svgtranslate.toolforge.org/). Added translation for bn. | |
| 2022년 9월 10일 (토) 19:53 |  | 960 × 893 (24 KB) | Theklan | File uploaded using svgtranslate tool (https://svgtranslate.toolforge.org/). Added translation for eu. | |
| 2022년 4월 19일 (화) 23:29 |  | 960 × 893 (21 KB) | Jiaminglimjm | File uploaded using svgtranslate tool (https://svgtranslate.toolforge.org/). Added translation for id. | |
| 2022년 1월 10일 (월) 13:37 |  | 960 × 893 (17 KB) | TAKAHASHI Shuuji | File uploaded using svgtranslate tool (https://svgtranslate.toolforge.org/). Added translation for ja. | |
| 2021년 8월 16일 (월) 06:33 |  | 960 × 893 (13 KB) | Efbrazil | Source updated to AR6 / WG1 | |
| 2020년 5월 14일 (목) 00:56 |  | 960 × 807 (11 KB) | Nyq | Decapitalized common nouns | |
| 2020년 3월 27일 (금) 03:47 |  | 960 × 807 (11 KB) | Efbrazil | Tweaked positive color to match other chart color for consistency | |
| 2020년 3월 4일 (수) 06:55 |  | 960 × 807 (11 KB) | Efbrazil | Rebuilt the graphic from data. Changes: - SVG now has native text for translation and selection - Combined "other gases" into single bar - Label tweaks for easier reading (e.g. CH4 --> Methane) |
이 파일을 사용하는 문서
다음 문서 1개가 이 파일을 사용하고 있습니다:
이 파일을 사용하고 있는 모든 위키의 문서 목록
다음 위키에서 이 파일을 사용하고 있습니다:
- ar.wikipedia.org에서 이 파일을 사용하고 있는 문서 목록
- az.wikipedia.org에서 이 파일을 사용하고 있는 문서 목록
- bcl.wikipedia.org에서 이 파일을 사용하고 있는 문서 목록
- de.wikipedia.org에서 이 파일을 사용하고 있는 문서 목록
- dty.wikipedia.org에서 이 파일을 사용하고 있는 문서 목록
- el.wikipedia.org에서 이 파일을 사용하고 있는 문서 목록
- en.wikipedia.org에서 이 파일을 사용하고 있는 문서 목록
- Causes of climate change
- Cloud feedback
- Sulfur dioxide
- Global dimming
- Radiative forcing
- Talk:Global dimming
- Climate change
- Carbon dioxide in Earth's atmosphere
- Talk:Greenhouse gas
- Greenhouse gas
- Atmospheric methane
- Portal:Climate change/Selected article
- Portal:Climate change/Selected article/16
- Gas venting
- Wikipedia:WikiProject Climate change/Figures
- Talk:Climate change/Archive 76
- Portal:Climate change
- Talk:Climate change/Archive 93
- User talk:InformationToKnowledge/sandbox
- eu.wikipedia.org에서 이 파일을 사용하고 있는 문서 목록
- fa.wikipedia.org에서 이 파일을 사용하고 있는 문서 목록
- fr.wikipedia.org에서 이 파일을 사용하고 있는 문서 목록
- gl.wikipedia.org에서 이 파일을 사용하고 있는 문서 목록
- ha.wikipedia.org에서 이 파일을 사용하고 있는 문서 목록
- hi.wikipedia.org에서 이 파일을 사용하고 있는 문서 목록
- hi.wikibooks.org에서 이 파일을 사용하고 있는 문서 목록
- id.wikipedia.org에서 이 파일을 사용하고 있는 문서 목록
- ig.wikipedia.org에서 이 파일을 사용하고 있는 문서 목록
- is.wikipedia.org에서 이 파일을 사용하고 있는 문서 목록
- ms.wikipedia.org에서 이 파일을 사용하고 있는 문서 목록
- nl.wikipedia.org에서 이 파일을 사용하고 있는 문서 목록
- pt.wikipedia.org에서 이 파일을 사용하고 있는 문서 목록
- rw.wikipedia.org에서 이 파일을 사용하고 있는 문서 목록
- so.wikipedia.org에서 이 파일을 사용하고 있는 문서 목록
- sv.wikipedia.org에서 이 파일을 사용하고 있는 문서 목록
- te.wikipedia.org에서 이 파일을 사용하고 있는 문서 목록
- tr.wikipedia.org에서 이 파일을 사용하고 있는 문서 목록
- zh.wikipedia.org에서 이 파일을 사용하고 있는 문서 목록
이 파일의 더 많은 사용 내역을 봅니다.