파일:Sinc function (both).svg
원본 파일(SVG 파일, 실제 크기 1,300 × 975 픽셀, 파일 크기: 42 KB)

파일 설명

설명
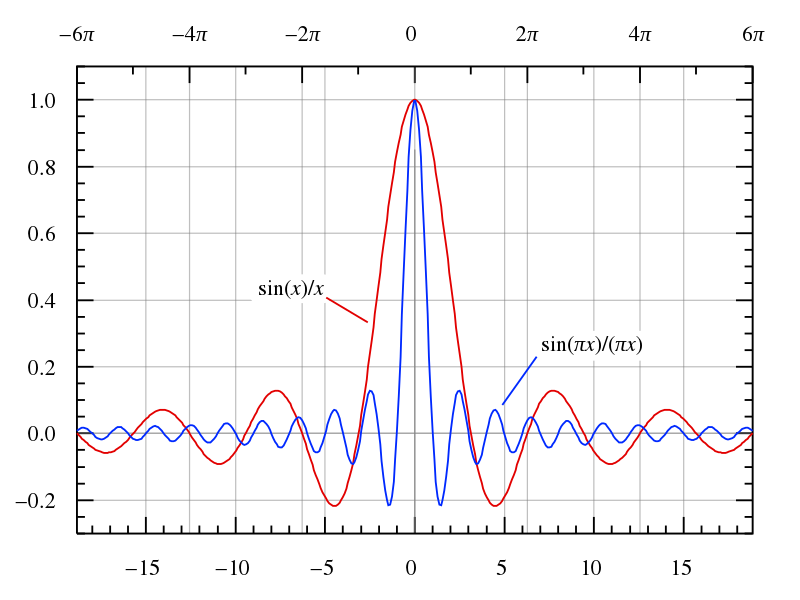
English: Graph of both the normalized (sin(πx)/(πx)) and unnormalized (sin(x)/x) definitions of the sinc function.

These are on the same scale. The second axis is just to clarify that the zero crossings occur on multiples of pi instead of integers.

Mathworld's version

Instructions:
See Wikipedia graph-making tips.

Then I opened the resulting SVG file in Inkscape, copy and pasted the Unicode π characters and modified those labels by hand, changed the line colors, brought the plot lines to the top, made all the lines 3 px wide, made the grid lines 2px wide and 50% transparency. I also manually reconnected the grid lines that were cut by the legend function, moved the legends down next to the graph, converted their example lines into directional arrow type lines, and put a white box behind the text instead of trying to cut the graph lines like gnuplot does.
날짜 2006년 6월 3일 (upload date)
출처 자작
저자 Omegatron
다른 버전
SVG 발전
InfoField
 
SVG 파일의 소스 코드를 12가지의 실수입니다.
 
이 W3C-무효 벡터 그림Inkscape(으)로 제작되었습니다.
 
 이 SVG 파일은 내장된 문자열을 사용하고 있으며 문서 편집기를 사용해서 쉽게 번역할 수 있습니다.
gnuplot source
InfoField
click to expand
# Set 1300×975 SVG output and filename
# The font size (fsize) sets the size for the circles, too.
set samples 400
set terminal svg enhanced size 1300 975 fname "Times" fsize 36
set output "sinc function (both).svg"

# Set y axis limits so the plot doesn't go right to the edges of the graph 
set yrange [-0.3:1.1]
set xrange [-6*pi:6*pi]

set lmargin 5
set bmargin -10

# No legend needed
#set nokey

# Add lightly-colored axis lines
set yzeroaxis
set xzeroaxis

# Put a y-axis tic at every 0.2
set ytics 0.2
set mytics 4

# Put an x-axis tic at every integer
set xtics 5
set format x "%2.0f"
set mxtics 5

# Put a second x-axis tic at every multiple of 2*pi

set x2tics 2*pi
set format x2 "%2.0f"
set mx2tics 2
set grid x x2 y
set xtics nomirror

# Format tics as digit with one decimal place
set format y "%2.1f"

# Plot as lines
plot sin(x)/x with lines, sin(pi*x)/(pi*x) with lines
 
# Close the file (so I don't have to close gnuplot to view it)
set output

라이선스

나는 아래 작품의 저작권자로서, 이 저작물을 다음과 같은 라이선스로 배포합니다:
w:ko:크리에이티브 커먼즈
저작자표시 동일조건변경허락
이 파일은 크리에이티브 커먼즈 저작자표시-동일조건변경허락 3.0, 2.5, 2.0, 1.0 라이선스로 배포됩니다.
이용자는 다음의 권리를 갖습니다:
  • 공유 및 이용 – 저작물의 복제, 배포, 전시, 공연 및 공중송신
  • 재창작 – 저작물의 개작, 수정, 2차적저작물 창작
다음과 같은 조건을 따라야 합니다:
  • 저작자표시 – 적절한 저작자 표시를 제공하고, 라이센스에 대한 링크를 제공하고, 변경사항이 있는지를 표시해야 합니다. 당신은 합리적인 방식으로 표시할 수 있지만, 어떤 방식으로든 사용권 허가자가 당신 또는 당신의 사용을 지지하는 방식으로 표시할 수 없습니다.
  • 동일조건변경허락 – 만약 당신이 이 저작물을 리믹스 또는 변형하거나 이 저작물을 기반으로 제작하는 경우, 당신은 당신의 기여물을 원저작물과 동일하거나 호환 가능한 라이선스에 따라 배포하여야 합니다.
GNU head GNU 자유 문서 사용 허가서 1.2판 또는 자유 소프트웨어 재단에서 발행한 이후 판의 규정에 따라 본 문서를 복제하거나 개작 및 배포할 수 있습니다. 본 문서에는 변경 불가 부분이 없으며, 앞 표지 구절과 뒷 표지 구절도 없습니다. 본 사용 허가서의 전체 내용은 GNU 자유 문서 사용 허가서 부분에 포함되어 있습니다.
이 라이선스 중에서 목적에 맞는 것을 선택하여 사용할 수 있습니다.

설명

이 파일이 나타내는 바에 대한 한 줄 설명을 추가합니다

이 파일에 묘사된 항목

다음을 묘사함

image/svg+xml

파일 역사

날짜/시간 링크를 클릭하면 해당 시간의 파일을 볼 수 있습니다.

날짜/시간섬네일크기사용자설명
현재2020년 3월 25일 (수) 02:122020년 3월 25일 (수) 02:12 판의 섬네일1,300 × 975 (42 KB)AkanoToEItalicized variables
2006년 6월 4일 (일) 03:082006년 6월 4일 (일) 03:08 판의 섬네일1,300 × 975 (42 KB)Omegatron

다음 문서 1개가 이 파일을 사용하고 있습니다:

이 파일을 사용하고 있는 모든 위키의 문서 목록

다음 위키에서 이 파일을 사용하고 있습니다:

메타데이터