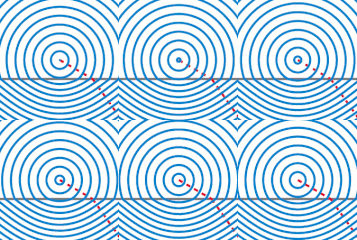
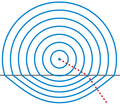
파일:Snells law wavefronts.gif

Snells_law_wavefronts.gif(225 × 227 픽셀, 파일 크기: 65 KB, MIME 종류: image/gif, 반복됨, 10 프레임, 0.1 s)

Titel

파일 설명

 
다이어그램MATLAB(으)로 제작되었습니다.
설명
English: Illustration of wavefronts in the context of Snell's law.
날짜 (UTC)
출처 Own work, created with MATLAB. (Source code below.)
저자 Oleg Alexandrov
저작권
(이 파일을 인용하기)
Public domain 나는 이 작품의 저작권자로서, 이 작품을 퍼블릭 도메인으로 모두에게 공개합니다. 이 공개 선언은 전 세계적으로 유효합니다.
만약 저작권의 포기가 법률적으로 가능하지 않은 경우,
나는 이 작품을 법적으로 허용되는 한도 내에서 누구나 자유롭게 어떤 목적으로도 제한없이 사용할 수 있도록 허용합니다.
다른 버전
이 그림은 벡터 그래픽 버전(SVG)이 있습니다. 래스터(비트맵) 그림 대신 벡터 그래픽 그림을 사용하는 것이 좋습니다.

File:Snells law wavefronts.gif → File:Snells law wavefronts.svg

벡터 그래픽에 대한 자세한 설명은 SVG 파일로 변환하기(영어) 문서를 참고해 주세요.
미디어위키의 SVG 그림 지원 정보(영어)도 같이 참고해주세요.

다른 언어로
Alemannisch  Bahasa Indonesia  Bahasa Melayu  British English  català  čeština  dansk  Deutsch  eesti  English  español  Esperanto  euskara  français  Frysk  galego  hrvatski  Ido  italiano  lietuvių  magyar  Nederlands  norsk bokmål  norsk nynorsk  occitan  Plattdüütsch  polski  português  português do Brasil  română  Scots  sicilianu  slovenčina  slovenščina  suomi  svenska  Tiếng Việt  Türkçe  vèneto  Ελληνικά  беларуская (тарашкевіца)  български  македонски  нохчийн  русский  српски / srpski  татарча/tatarça  українська  ქართული  հայերեն  বাংলা  தமிழ்  മലയാളം  ไทย  한국어  日本語  简体中文  繁體中文  עברית  العربية  فارسی  +/−
새 SVG 이름

Source code

% Illustration of Snell's law
function main()

   % indexes of refraction
   n1=1.0;
   n2=1.5;

   sign = -1;% is the source up or down?
   O=[0, -1*sign];
   k=500;

   
% KSmrq's colors
   red    = [0.867 0.06 0.14];
   blue   = [0, 129, 205]/256;
   green  = [0, 200,  70]/256;
   yellow = [254, 194,   0]/256;
   white = 0.99*[1, 1, 1];
   black = [0, 0, 0];
   gray = 0.5*white;

   color1=red;
   color2=blue;
   color3=gray;
   lw = 3;
   
   plot_line=0;
   Theta=linspace(0, 2*pi, k);
   V=0*Theta; W=0*Theta;
   S0=7;
   spacing=0.45;
   p=floor(S0/spacing);
   S=linspace(0, S0, p+1);
   spacing=S(2)-S(1);
   
   num_frames = 10;
   for frame_iter=1:num_frames

      figure(1); clf; hold on; axis equal; axis off;

      % plot the interface between diellectrics
      L=1.2*S0;
      plot([-L, L], [0, 0], 'color', color3, 'linewidth', lw);
      
      
      % plot a ray
      plot_line=1;
      s=L;
      theta=pi/3; wfr(s, theta, n1, n2, O, sign, plot_line, color1, lw);

      % plot the wafefronts
      plot_line=0;
      for i=1:p

	 s=S(i)+spacing*(frame_iter-1)/num_frames;

	 for j=1:k
	    theta=Theta(j);
	    [V(j), W(j)]=wfr(s, theta, n1, n2, O, sign, plot_line, color1, lw);
	 end
	 plot(V, W, 'color', color2, 'linewidth', lw);
      end
      

      %  dummy points to enlarge the bounding box
      plot(0, S0+2.5*spacing, '*', 'color', white);
      plot(0, -(S0+2.5*spacing)/n2, '*', 'color', white);

      % to know where to crop later
      Lx=3.2; Ly=Lx; shift = 1;
      plot([-Lx, Lx, Lx, -Lx -Lx], ...
           [-Ly, -Ly, Ly, Ly, -Ly]+shift);

      file = sprintf('Frame%d.eps', 1000+frame_iter);
      disp(file);
      saveas(gcf, file, 'psc2')
   end
end

% Converted to gif with the UNIX command
% convert -density 100 -antialias Frame10* Snell_animation.gif 
% then cropped in Gimp

function [a, b]=wfr(s, theta, n1, n2, O, sign, plot_line, color1, lw);

   X=O+s*[sin(theta), sign*cos(theta)];

  if( sign*X(2) > 0 )
    t=-sign*O(2)/cos(theta);
    X0=O+t*[sin(theta), sign*cos(theta)];
    
    if (plot_line == 1) 
      plot([O(1), X0(1)], [O(2), X0(2)], 'color', color1, 'linewidth', lw, 'linestyle', '--');
    end

    d = norm(O-X0);
    r = (s-d)*(n2/n1)^(sign);

    theta2=asin(n1*sin(theta)/n2);
    XE=X0+r*[sin(theta2), sign*cos(theta2)];
  else
    XE = X;
  end  
  a = XE(1);
  b = XE(2); 

  if (plot_line==1)
    plot([X0(1), XE(1)], [X0(2), XE(2)], 'color', color1, 'linewidth', lw, 'linestyle', '--');
  end  
end

설명

이 파일이 나타내는 바에 대한 한 줄 설명을 추가합니다
Wavefronts from a point source of light.In a particuler wavefront u will see that the dist btw source & wavefront above the line is > dist btw source & wavefront below the line beacuse lightspeed is greater in the above and lower in below.

이 파일에 묘사된 항목

다음을 묘사함

파일 역사

날짜/시간 링크를 클릭하면 해당 시간의 파일을 볼 수 있습니다.

날짜/시간섬네일크기사용자설명
현재2009년 7월 5일 (일) 18:592009년 7월 5일 (일) 18:59 판의 섬네일225 × 227 (65 KB)Capmoreduced to 16 colors with no quality loss
2008년 1월 2일 (수) 15:312008년 1월 2일 (수) 15:31 판의 섬네일225 × 227 (148 KB)Oleg Alexandrov{{Information |Description=Illustration of wavefronts in the context of Snell's law. |Source=self-made with MATLAB |Date=05:36, 1 January 2008 (UTC) |Author= Oleg Alexandrov |Permission= |oth

다음 문서 1개가 이 파일을 사용하고 있습니다:

이 파일을 사용하고 있는 모든 위키의 문서 목록

다음 위키에서 이 파일을 사용하고 있습니다:

이 파일의 더 많은 사용 내역을 봅니다.