Circle_cos_sin.gif(650 × 390 픽셀, 파일 크기: 517 KB, MIME 종류: image/gif, 반복됨, 60 프레임, 6.0 s)

파일 설명

설명
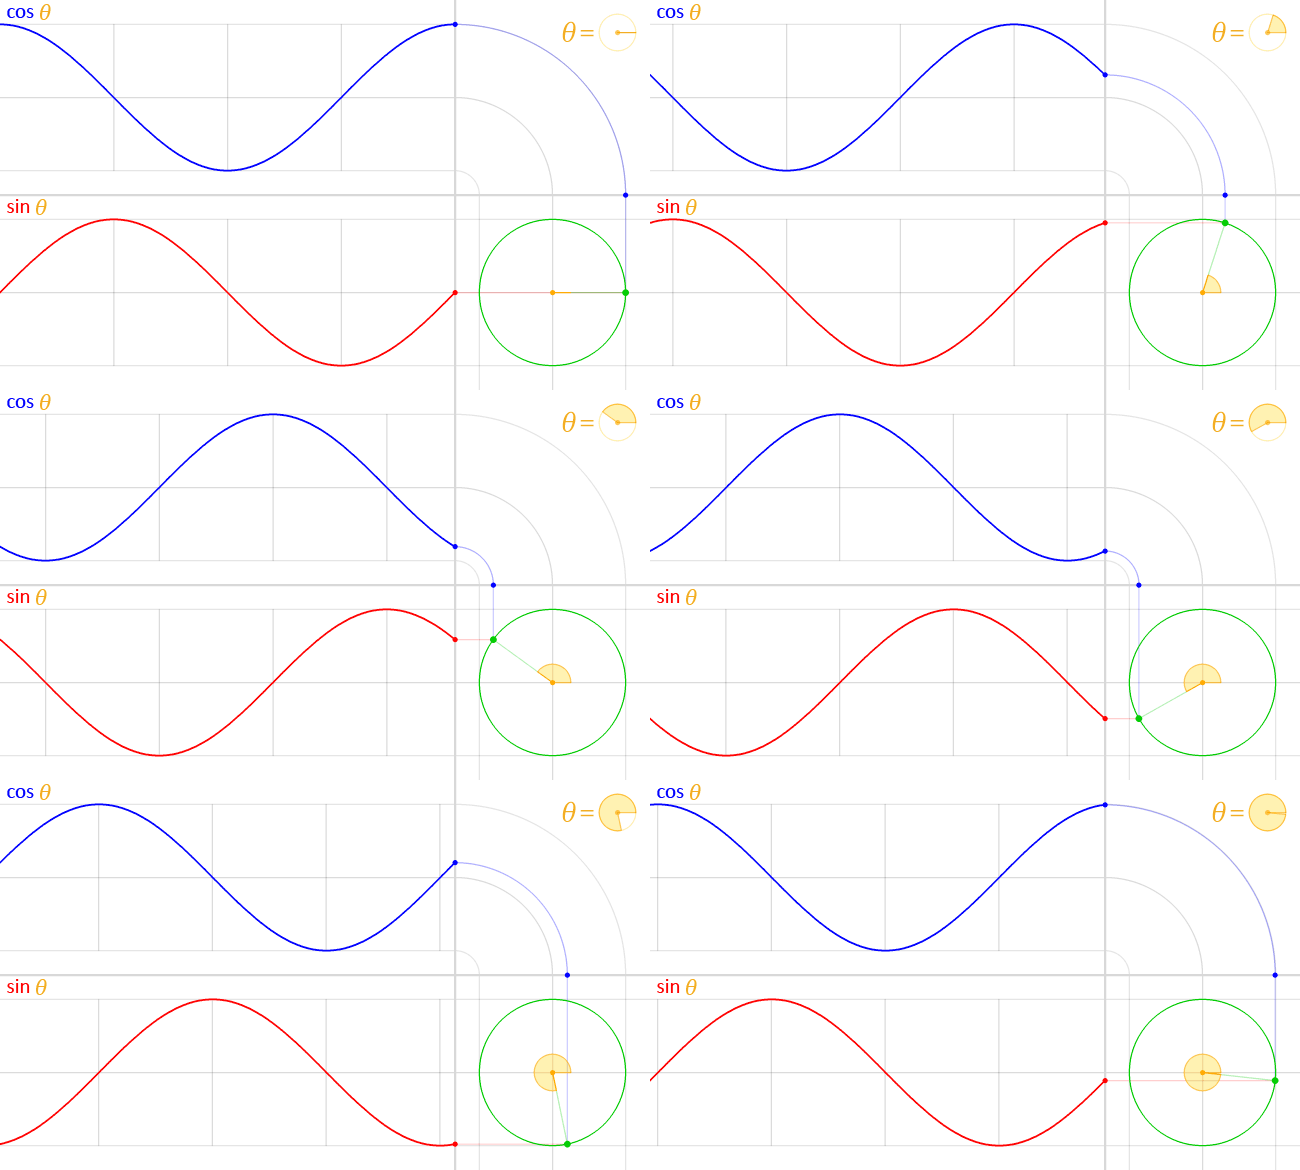
English: We have the unit circle (with radius = 1) in green, placed at the origin at the bottom right.

In the middle of this circle, in yellow, is represented the angle theta (θ). This angle is the amount of counter-clockwise rotation around the circle starting from the right, on the x-axis, as illustrated. An exact copy of this little angle is shown at the top right, as a visual illustration of the definition of θ.

At this angle, and starting at the origin, a (faint) green line is traced outwards, radially. This line intersects the unit circle at a single point, which is the green point spinning around at a constant rate as the angle θ changes, also at a constant rate.

The vertical position of this point is projected straight (along the faint red line) onto the graph on the left of the circle. This results in the red point. The y-coordinate of this red point (the same as the y-coordinate of the green point) is the value of the sine function evaluated at the angle θ, that is:

y coordinate of green point = sin θ

As the angle θ changes, the red point moves up and down, tracing the red graph. This is the graph for the sine function. The faint vertical lines seen passing to the left are marking every quadrant along the circle, that is, at every angle of 90° or π/2 radians. Notice how the sine curve goes from 1, to zero, to -1, then back to zero, at exactly these lines. This is reflecting the fact sin(0) = 0, sin(π/2) =1, sin(π) = 0 and sin(3π/ 2) -1

A similar process is done with the x-coordinate of the green point. However, since the x-coordinate is tilted from the usual convention to plot graphs (where y = f(x), with y vertical and x horizontal), an “untilt” operation was performed in order to repeat the process again in the same orientation, instead of vertically. This was represented by a “bend”, seen on the top right.

Again, the green point is projected upwards (along the faint blue line) and this “bent” projection ends up in the top graph’s rightmost edge, at the blue point. The y-coordinate of this blue point (which, due to the “bend” in the projection, is the same as the x-coordinate of the green point) is the value of the cosine function evaluated at the angle θ, that is:

x coordinate of green point = cos θ
The blue curve traced by this point, as it moves up and down with changing θ, is the the graph of the cosine function. Notice again how it behaves at it crosses every quadrant, reflecting the fact cos(0) = 1, cos(π/2) = 0, cos(π) = -1 and cos(3π/2) = 0.
날짜
출처 자작
저자 Lucas Vieira
저작권
(이 파일을 인용하기)
Public domain 나는 이 작품의 저작권자로서, 이 작품을 퍼블릭 도메인으로 모두에게 공개합니다. 이 공개 선언은 전 세계적으로 유효합니다.
만약 저작권의 포기가 법률적으로 가능하지 않은 경우,
나는 이 작품을 법적으로 허용되는 한도 내에서 누구나 자유롭게 어떤 목적으로도 제한없이 사용할 수 있도록 허용합니다.

설명

이 파일이 나타내는 바에 대한 한 줄 설명을 추가합니다

c06fd6a5f798c5ac8eb37784d218a2f190916f4d

529,197 바이트

5.999999999999995

390 화소

650 화소

파일 역사

날짜/시간 링크를 클릭하면 해당 시간의 파일을 볼 수 있습니다.

날짜/시간섬네일크기사용자설명
현재2014년 6월 24일 (화) 09:322014년 6월 24일 (화) 09:32 판의 섬네일650 × 390 (517 KB)LucasVBReverted to version as of 15:59, 16 March 2014
2014년 6월 23일 (월) 08:002014년 6월 23일 (월) 08:00 판의 섬네일390 × 650 (390 KB)SteinsplitterBotBot: Image rotated by 90°
2014년 3월 17일 (월) 00:592014년 3월 17일 (월) 00:59 판의 섬네일650 × 390 (517 KB)LucasVB{{Information |Description ={{en|1=sin & cos}} |Source ={{own}} |Author =LucasVB |Date =2014-03-16 |Permission ={{PD-self}} |other_versions = }} Category:Trigonometry [[Category:Trigonometric funct...

다음 문서 1개가 이 파일을 사용하고 있습니다:

이 파일을 사용하고 있는 모든 위키의 문서 목록

다음 위키에서 이 파일을 사용하고 있습니다: