파일:Diathesisstressdualriskmodel.JPG

미리 보기 크기: 800 × 598 픽셀 다른 해상도: 320 × 239 픽셀 | 640 × 478 픽셀 | 885 × 661 픽셀
원본 파일 (885 × 661 픽셀, 파일 크기: 49 KB, MIME 종류: image/jpeg)


파일 설명
| 설명 |
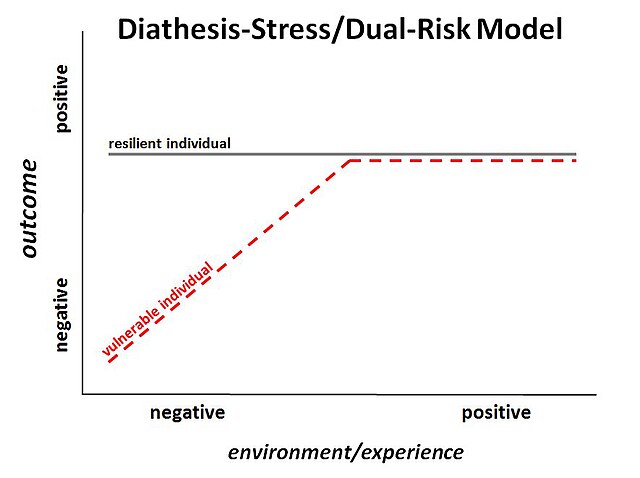
English: Figure 1. Graphical display of the diathesis-stress/dual-risk model. The X-axis indicates quality of the environment/experiences from negative to positive. The Y-axis indicates the developmental outcome from negative to positive. The lines depict two categorical groups that differ in their responsiveness to a negative environment: the “vulnerable” group shows a negative outcome when exposed to a negative environment, while the “resilient” group is not affected by it. No differences between the two groups emerge in a positive environment. |
| 출처 | 자작 |
| 저자 | Mpluess |
라이선스
| 나는 이 작품의 저작권자로서, 이 작품을 퍼블릭 도메인으로 모두에게 공개합니다. 이 공개 선언은 전 세계적으로 유효합니다. 만약 저작권의 포기가 법률적으로 가능하지 않은 경우, 나는 이 작품을 법적으로 허용되는 한도 내에서 누구나 자유롭게 어떤 목적으로도 제한없이 사용할 수 있도록 허용합니다. |
파일 역사
날짜/시간 링크를 클릭하면 해당 시간의 파일을 볼 수 있습니다.
| 날짜/시간 | 섬네일 | 크기 | 사용자 | 설명 | |
|---|---|---|---|---|---|
| 현재 | 2009년 7월 27일 (월) 19:51 | | 885 × 661 (49 KB) | Mpluess | {{Information |Description={{en|1=Diathesis-Stress / Dual-Risk Model}} |Source=Own work by uploader |Author=Mpluess |Date= |Permission= |other_versions= }} |
이 파일을 사용하는 문서
다음 문서 1개가 이 파일을 사용하고 있습니다:
이 파일을 사용하고 있는 모든 위키의 문서 목록
다음 위키에서 이 파일을 사용하고 있습니다:
- ar.wikipedia.org에서 이 파일을 사용하고 있는 문서 목록
- bs.wikipedia.org에서 이 파일을 사용하고 있는 문서 목록
- ca.wikipedia.org에서 이 파일을 사용하고 있는 문서 목록
- en.wikipedia.org에서 이 파일을 사용하고 있는 문서 목록
- fa.wikipedia.org에서 이 파일을 사용하고 있는 문서 목록
- fr.wikipedia.org에서 이 파일을 사용하고 있는 문서 목록
- he.wikipedia.org에서 이 파일을 사용하고 있는 문서 목록
- ja.wikipedia.org에서 이 파일을 사용하고 있는 문서 목록
- uk.wikipedia.org에서 이 파일을 사용하고 있는 문서 목록
- zh.wikipedia.org에서 이 파일을 사용하고 있는 문서 목록