파일:Oil consumption per day by region from 1980 to 2006.svg

SVG 파일의 PNG 형식의 미리보기 크기: 600 × 450 픽셀. 다른 해상도: 320 × 240 픽셀 | 640 × 480 픽셀 | 1,024 × 768 픽셀 | 1,280 × 960 픽셀 | 2,560 × 1,920 픽셀
원본 파일 (SVG 파일, 실제 크기 600 × 450 픽셀, 파일 크기: 204 KB)
| 설명 |
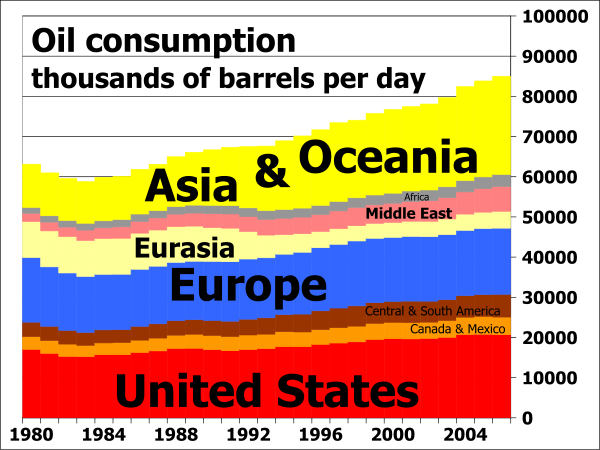
English: Oil consumption in daily barrels per region from 1980 to 2006; vertical extents indicate barrels of oil consumed per day, and the horizontal scale shows years from 1980 to 2007. |
| 날짜 | |
| 출처 |
I, 84user, created this work using the excel file RecentPetroleumConsumptionBarrelsperDay.xls from the U.S. Energy Information Administration's web page http://tonto.eia.doe.gov/dnav/pet/pet_pri_wco_k_w.htm (direct link: http://www.eia.doe.gov/emeu/international/RecentPetroleumConsumptionBarrelsperDay.xls) and using Open Source Gnumeric 1.9.1 to produce the chart. See also  |
| 저자 | 84user |
| 저작권 (이 파일을 인용하기) |
PD-SELF; Released into the public domain (by the author). |
| 다른 버전 |
 |
See also


라이선스
| 이 작품은 저작자인 84user에 의해 퍼블릭 도메인으로 공개된 작품입니다. 이 공개 선언은 전 세계적으로 유효합니다. 만약 저작권의 포기가 법률적으로 가능하지 않은 경우, |
파일 역사
날짜/시간 링크를 클릭하면 해당 시간의 파일을 볼 수 있습니다.
| 날짜/시간 | 섬네일 | 크기 | 사용자 | 설명 | |
|---|---|---|---|---|---|
| 현재 | 2008년 10월 25일 (토) 23:52 | | 600 × 450 (204 KB) | 84user | increased main title font size |
| 2008년 10월 25일 (토) 23:31 |  | 600 × 450 (195 KB) | 84user | {{Information |Description={{en|Oil consumption in daily barrels per region from 1980 to 2006; vertical extents indicate barrels of oil consumed per day, and the horizontal scale shows years from 1980 to 2007.}} |Source=I, 84user, created this work using |
이 파일을 사용하는 문서
다음 문서 1개가 이 파일을 사용하고 있습니다:
이 파일을 사용하고 있는 모든 위키의 문서 목록
다음 위키에서 이 파일을 사용하고 있습니다:
- en.wikipedia.org에서 이 파일을 사용하고 있는 문서 목록
- es.wikipedia.org에서 이 파일을 사용하고 있는 문서 목록
- fa.wikipedia.org에서 이 파일을 사용하고 있는 문서 목록
- id.wikipedia.org에서 이 파일을 사용하고 있는 문서 목록
- th.wikipedia.org에서 이 파일을 사용하고 있는 문서 목록
- ur.wikipedia.org에서 이 파일을 사용하고 있는 문서 목록