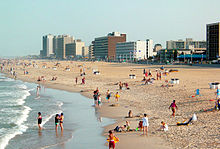
버지니아비치
미국 버지니아주에 있는 도시
버지니아비치(Virginia Beach)는 미국 버지니아주에 있는 독립시이다. 인구 425,257명 (2000년)으로 버지니아주 최대, 미국 전체에서 40째로 큰 도시이다.

인구
편집| 역사적 인구 | |||
|---|---|---|---|
| 인구조사 | 인구 | %± | |
| 1910년 | 320 | — | |
| 1920년 | 846 | 164.4% | |
| 1930년 | 1,719 | 103.2% | |
| 1940년 | 2,600 | 51.3% | |
| 1950년 | 5,390 | 107.3% | |
| 1960년 | 8,091 | 50.1% | |
| 1970년 | 172,106 | 2,027.1% | |
| 1980년 | 262,199 | 52.3% | |
| 1990년 | 393,069 | 49.9% | |
| 2000년 | 425,257 | 8.2% | |
| 2010년 | 437,994 | 3.0% | |
| 2019 (추산) | 449,974 | [1] | 2.7% |
| U.S. Decennial Census[2] 1790-1960[3] 1900-1990[4] 1990-2000[5] | |||
기후
편집| 노퍽 (노퍽 국제공항)의 기후 | |||||||||||||
|---|---|---|---|---|---|---|---|---|---|---|---|---|---|
| 월 | 1월 | 2월 | 3월 | 4월 | 5월 | 6월 | 7월 | 8월 | 9월 | 10월 | 11월 | 12월 | 연간 |
| 최고 기온 기록 °C (°F) | 29 (84) |
28 (82) |
33 (92) |
36 (97) |
38 (100) |
39 (102) |
41 (105) |
41 (105) |
38 (100) |
35 (95) |
30 (86) |
28 (82) |
41 (105) |
| 평균 일 최고 기온 °C (°F) | 10.4 (50.7) |
11.9 (53.4) |
15.6 (60.1) |
21.1 (70.0) |
25.2 (77.4) |
29.6 (85.2) |
31.9 (89.4) |
30.5 (86.9) |
27.4 (81.4) |
22.4 (72.3) |
16.7 (62.1) |
12.6 (54.7) |
21.3 (70.3) |
| 일 평균 기온 °C (°F) | 5.7 (42.2) |
6.8 (44.2) |
10.4 (50.7) |
15.6 (60.1) |
20.2 (68.3) |
24.8 (76.7) |
27.3 (81.1) |
26.2 (79.2) |
23.3 (74.0) |
17.6 (63.7) |
11.8 (53.3) |
7.8 (46.1) |
16.4 (61.6) |
| 평균 일 최저 기온 °C (°F) | 0.9 (33.6) |
1.7 (35.1) |
5.2 (41.3) |
10.1 (50.1) |
15.1 (59.1) |
20.1 (68.1) |
22.7 (72.8) |
22.0 (71.6) |
19.2 (66.6) |
12.8 (55.1) |
6.9 (44.4) |
3.1 (37.6) |
11.6 (52.9) |
| 최저 기온 기록 °C (°F) | −19 (−3) |
−17 (2) |
−10 (14) |
−5 (23) |
2 (36) |
7 (45) |
12 (54) |
9 (49) |
4 (40) |
−3 (27) |
−8 (17) |
−15 (5) |
−19 (−3) |
| 평균 강수량 mm (인치) | 87 (3.41) |
74 (2.90) |
94 (3.69) |
86 (3.37) |
96 (3.78) |
113 (4.43) |
154 (6.08) |
149 (5.88) |
137 (5.40) |
98 (3.86) |
79 (3.10) |
83 (3.28) |
1,249 (49.18) |
| 평균 강설량 cm (인치) | 8.1 (3.2) |
3.8 (1.5) |
1.0 (0.4) |
0.0 (0.0) |
0.0 (0.0) |
0.0 (0.0) |
0.0 (0.0) |
0.0 (0.0) |
0.0 (0.0) |
0.0 (0.0) |
0.0 (0.0) |
2.8 (1.1) |
16 (6.2) |
| 평균 강수일수 (≥ 0.01 인치) | 10.7 | 9.2 | 10.9 | 10.0 | 11.2 | 9.7 | 10.6 | 10.2 | 9.4 | 7.7 | 8.9 | 9.9 | 118.4 |
| 평균 강설일수 (≥ 0.1 인치) | 1.7 | 1.3 | 0.5 | 0.0 | 0.0 | 0.0 | 0.0 | 0.0 | 0.0 | 0.0 | 0.0 | 0.5 | 4.0 |
| 평균 상대 습도 (%) | 66.3 | 65.6 | 64.6 | 62.8 | 68.8 | 70.6 | 73.3 | 75.2 | 74.4 | 72.1 | 68.5 | 67.0 | 69.1 |
| 평균 월간 일조시간 | 171.5 | 175.2 | 229.3 | 252.8 | 271.7 | 280.1 | 278.3 | 260.4 | 231.4 | 208.3 | 175.7 | 160.4 | 2,695.1 |
| 가능 일조율 | 56 | 58 | 62 | 64 | 62 | 64 | 62 | 62 | 62 | 60 | 57 | 53 | 61 |
| 출처: 미국 해양대기청 (평균값: 1991년~2020년, 극값: 1874년~현재, 상대습도/일조: 1961년~1990년)[6][7][8] | |||||||||||||
같이 보기
편집각주
편집- ↑ “Population and Housing Unit Estimates”. 2020년 5월 21일에 확인함.
- ↑ “U.S. Decennial Census”. United States Census Bureau. 2014년 1월 2일에 확인함.
- ↑ “Historical Census Browser”. University of Virginia Library. 2012년 8월 11일에 원본 문서에서 보존된 문서. 2014년 1월 2일에 확인함.
- ↑ “Population of Counties by Decennial Census: 1900 to 1990”. United States Census Bureau. 2014년 1월 2일에 확인함.
- ↑ “Census 2000 PHC-T-4. Ranking Tables for Counties: 1990 and 2000” (PDF). United States Census Bureau. 2014년 1월 2일에 확인함.
- ↑ “NowData – NOAA Online Weather Data”. 미국 해양대기청. 2021년 5월 18일에 확인함.
- ↑ “Station: NORFOLK INTL AP, VA”. 《U.S. Climate Normals 2020: U.S. Monthly Climate Normals (1991–2020)》. 미국 해양대기청. 2021년 5월 18일에 확인함.
- ↑ “WMO Climate Normals for NORFOLK/INTL, VA 1961–1990”. 미국 해양대기청. 2020년 7월 29일에 확인함.
- 내용주
외부 링크
편집- 버지니아비치 공식 홈페이지 Archived 2005년 9월 1일 - 웨이백 머신 (영어)