파일:2015-2016 Australian region cyclone season summary.png
미리 보기 크기: 800 × 571 픽셀 다른 해상도: 320 × 229 픽셀 | 640 × 457 픽셀 | 1,024 × 731 픽셀 | 1,280 × 914 픽셀 | 2,560 × 1,828 픽셀 | 4,000 × 2,857 픽셀
원본 파일 (4,000 × 2,857 픽셀, 파일 크기: 5.39 MB, MIME 종류: image/png)
| 설명 |
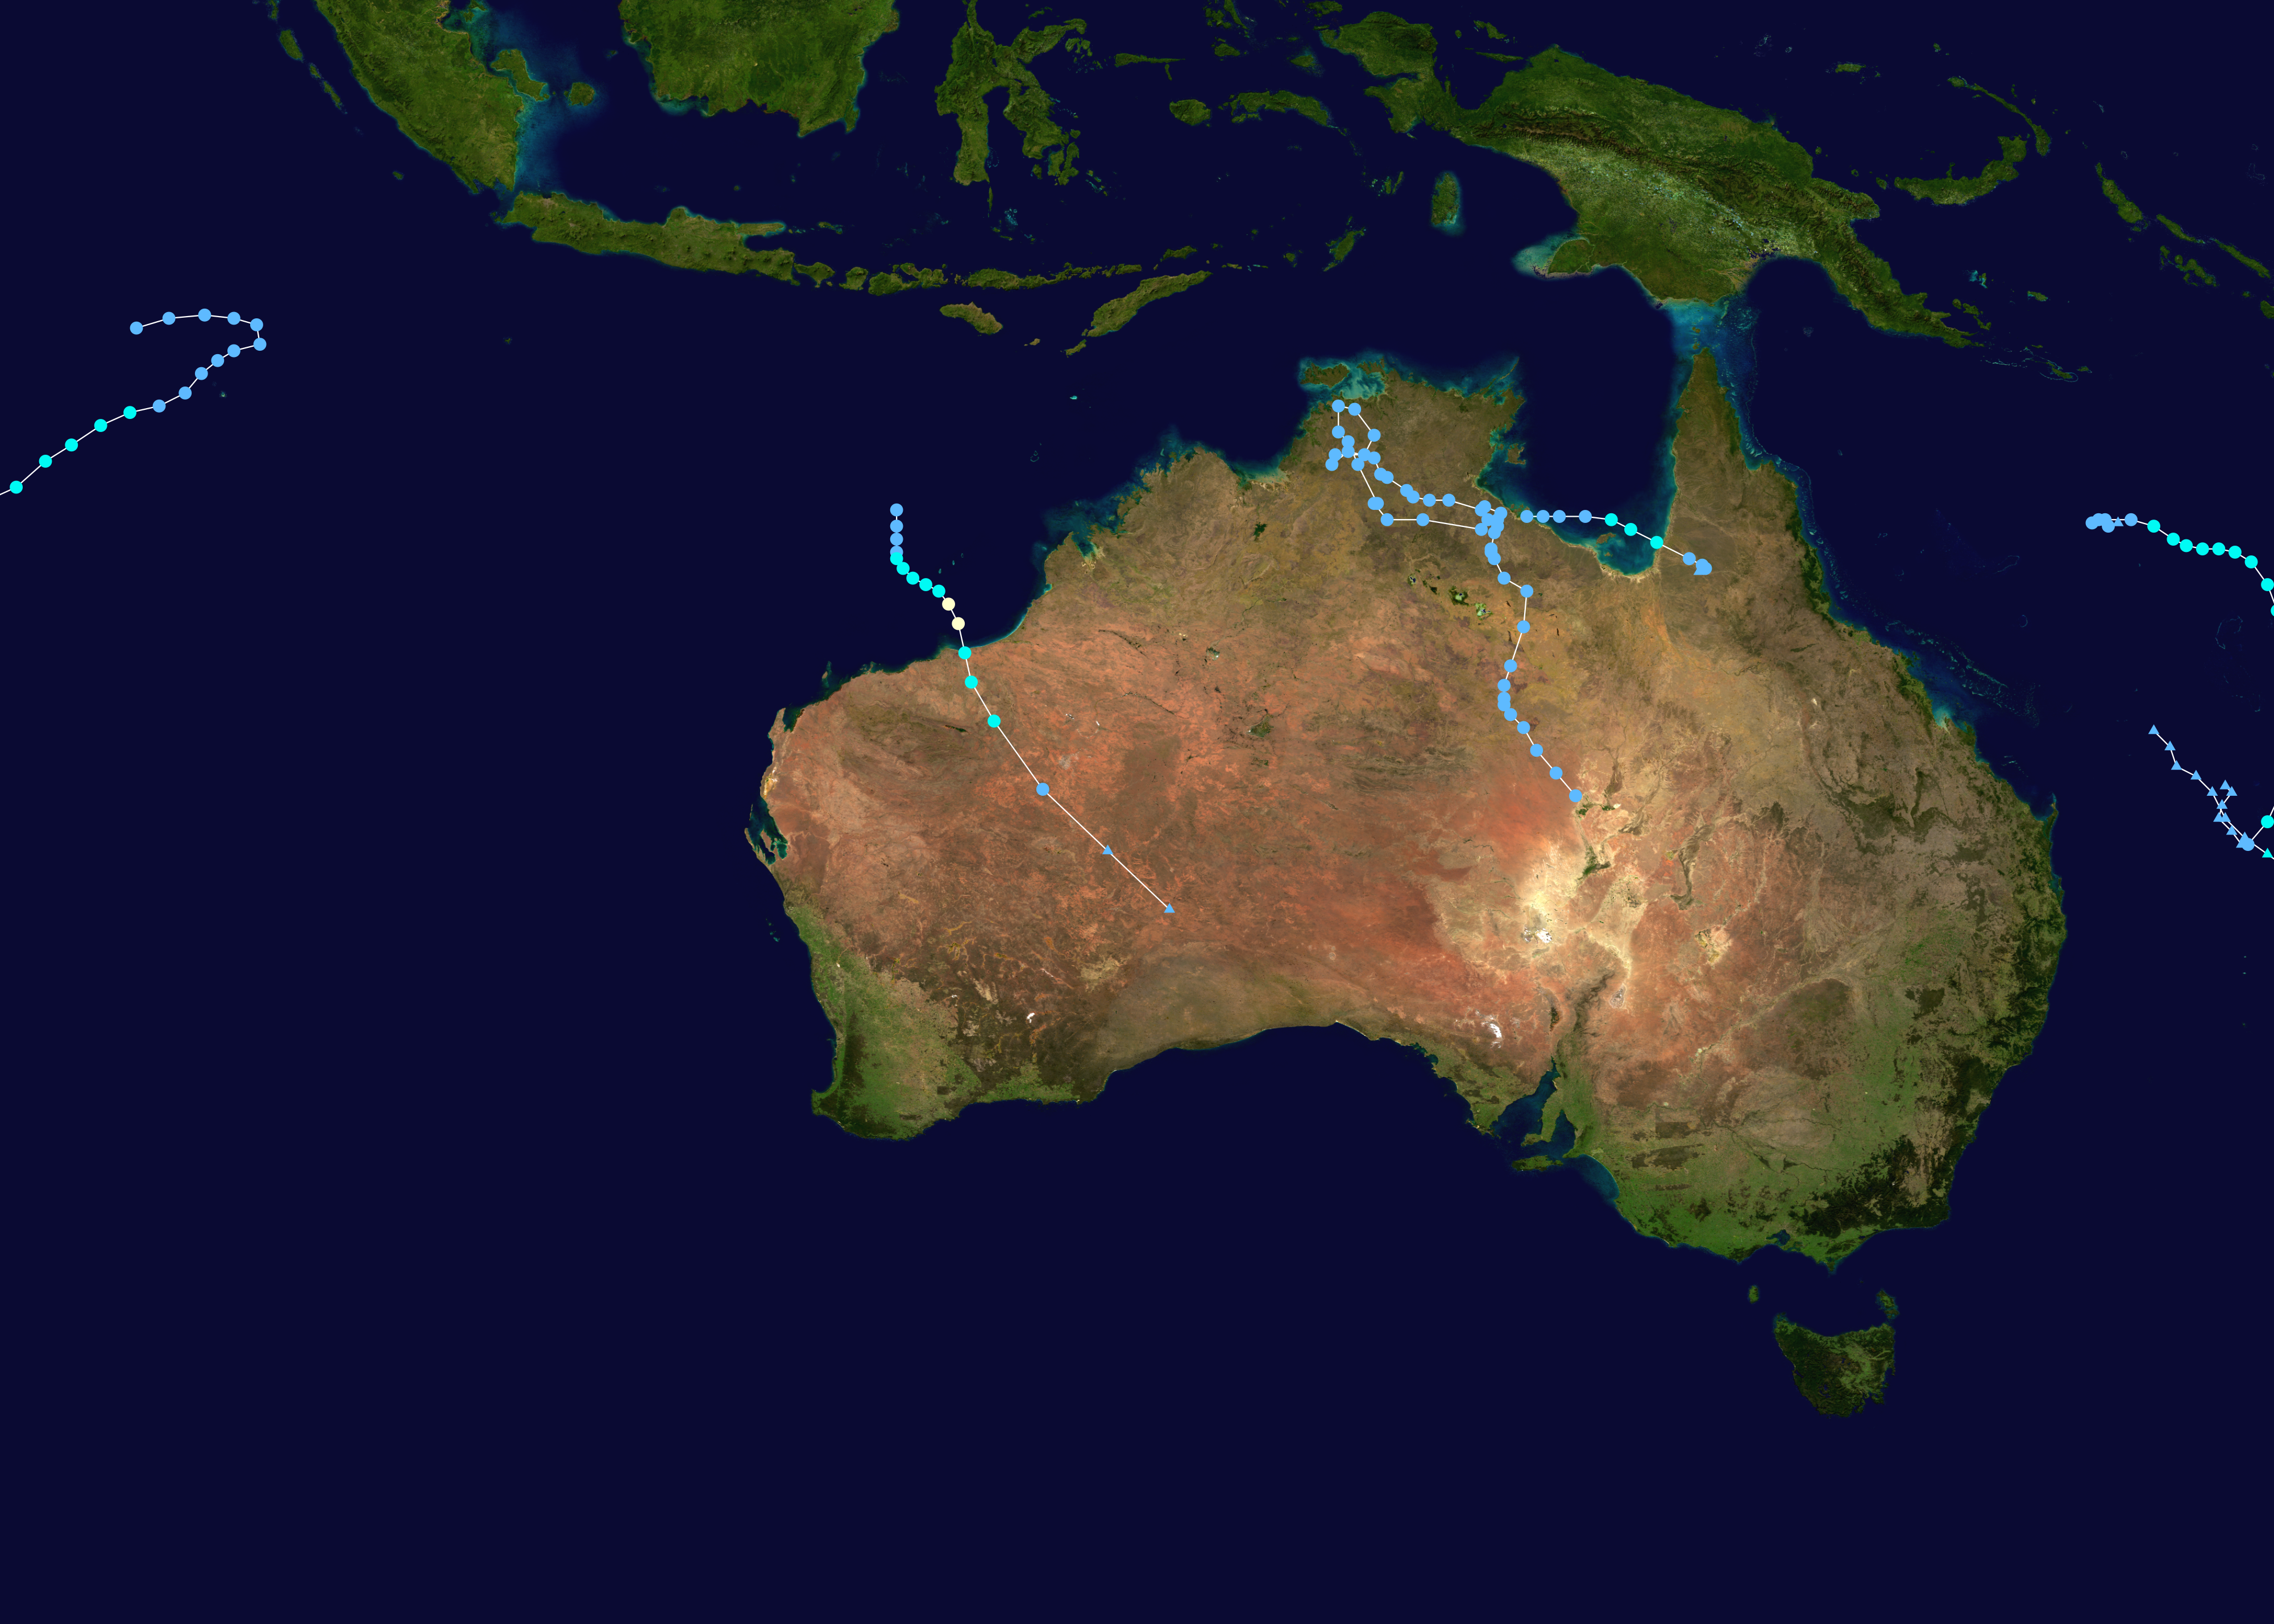
English: This map shows the tracks of all tropical cyclones in the 2015-16 Australian region cyclone season. The points show the location of each storm at 6-hour intervals. The colour represents the storm's maximum sustained wind speeds as classified in the Saffir-Simpson Hurricane Scale (see below), and the shape of the data points represent the type of the storm.
열대저기압 (≤38 mph, ≤62 km/h)
열대폭풍 (39–73 mph, 63–118 km/h)
1등급 (74–95 mph, 119–153 km/h)
2등급 (96–110 mph, 154–177 km/h)
3등급 (111–129 mph, 178–208 km/h)
4등급 (130–156 mph, 209–251 km/h)
5등급 (≥157 mph, ≥252 km/h)
알 수 없음
|
| 출처 | Created using Wikipedia:WikiProject Tropical cyclones/Tracks. The background image is from NASA [1]. The tracking data is from the Joint Typhoon Warning Center's best track database |
| 저자 | Keith Edkins |
| 이 작품은 저작자인 Keith Edkins에 의해 퍼블릭 도메인으로 공개된 작품입니다. 이 공개 선언은 전 세계적으로 유효합니다. 만약 저작권의 포기가 법률적으로 가능하지 않은 경우, Keith Edkins은 이 작품을 법적으로 허용되는 한도 내에서 누구나 자유롭게 어떤 목적으로도 제한 없이 사용할 수 있도록 허용합니다. |
파일 역사
날짜/시간 링크를 클릭하면 해당 시간의 파일을 볼 수 있습니다.
| 날짜/시간 | 섬네일 | 크기 | 사용자 | 설명 | |
|---|---|---|---|---|---|
| 현재 | 2020년 2월 21일 (금) 16:58 | | 4,000 × 2,857 (5.39 MB) | Supportstorm | Best track update |
| 2016년 3월 7일 (월) 13:00 |  | 4,000 × 2,472 (6.25 MB) | Cyclonebiskit | Update; remove Ex-Stan portion that's not official | |
| 2016년 2월 19일 (금) 12:02 |  | 4,000 × 2,472 (6.25 MB) | Cyclonebiskit | Update | |
| 2016년 1월 19일 (화) 03:04 |  | 3,000 × 1,854 (3.43 MB) | Keith Edkins | {{Hurricane season auto track map|start=|end=|source=JTWC|type=cyclone|basin=Australian region|year=2015-16|author=Keith Edkins}} |
이 파일을 사용하는 문서
다음 문서 1개가 이 파일을 사용하고 있습니다:
이 파일을 사용하고 있는 모든 위키의 문서 목록
다음 위키에서 이 파일을 사용하고 있습니다:
- en.wikipedia.org에서 이 파일을 사용하고 있는 문서 목록
- pt.wikipedia.org에서 이 파일을 사용하고 있는 문서 목록
- th.wikipedia.org에서 이 파일을 사용하고 있는 문서 목록
- zh.wikipedia.org에서 이 파일을 사용하고 있는 문서 목록