파일:COVID-19 Outbreak World Map per Capita.svg

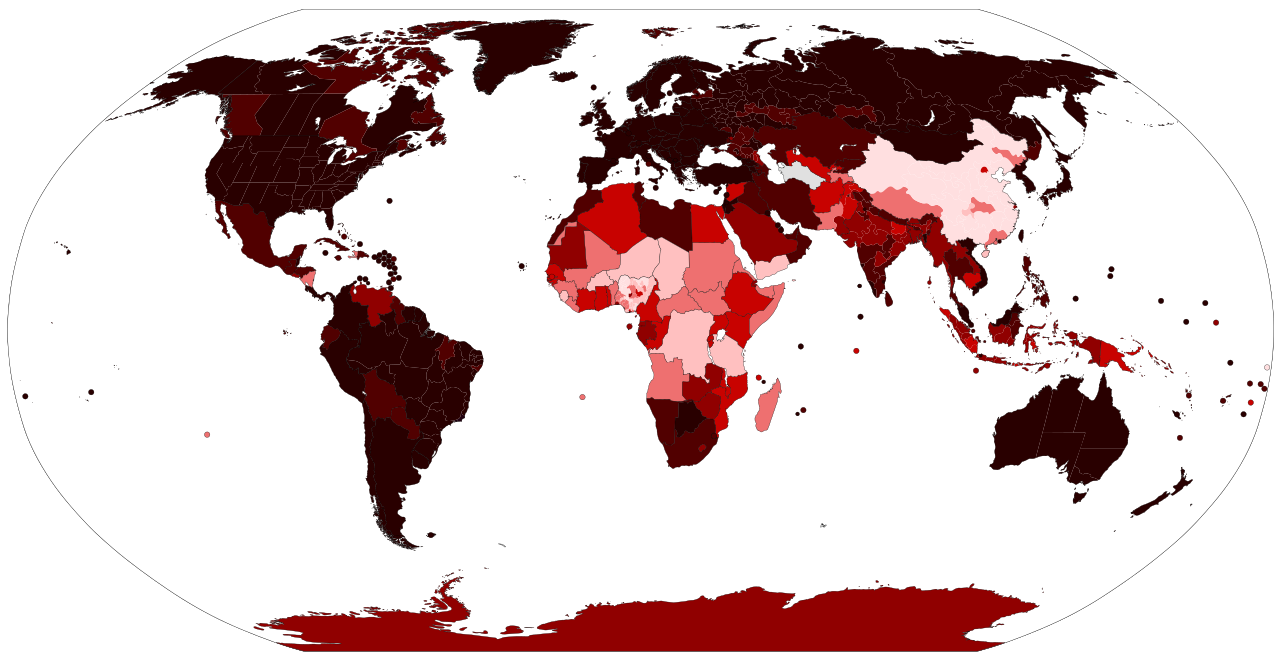
원본 파일 (SVG 파일, 실제 크기 2,921 × 1,500 픽셀, 파일 크기: 2.78 MB)

|
이 파일은 최신 정보를 받아서 업데이트될 가능성이 있습니다. 새로운 업데이트가 반영되는 것 없이, 특정 판의 파일을 사용한 경우에는, 필요한 판을 다른 파일로서 업로드해주세요. |
파일 설명
| 설명 |
Deutsch: Häufigkeit der gemeldeten Corona-Infektionen / pro 1000 Einwohner English: Map of the COVID-19 verified number of infected per capita as of . In the latest versions of the map there is a color bar legend. See the file history farther down for the latest upload date from the source. Español: Mapa del número verificado de infectados per cápita por la COVID-19 al . > 100 casos por 1.000 habitantes 30 – 100 casos por 1.000 habitantes 10 – 30 casos por 1.000 habitantes 3 – 10 casos por 1.000 habitantes 1 – 3 casos por 1.000 habitantes 0.3 – 1 casos por 1.000 habitantes > 0 – 0.3 casos por 1.000 habitantes No hay casos notificados, no hay población o no hay datos disponibles Français : Carte du nombre vérifié de cas d’infection à la covid-19 par habitant au . Português: Mapa do número de casos verificados de infectados pela COVID-19 per capita em . Русский: Карта количества подтверждённых случаев заражения COVID-19 на душу населения по состоянию на .y Українська: Карта підтвердженого числа інфікованих COVID-19 на душу населення станом на . 中文: 經驗證的各國感染人均COVID-19病例地圖,資料於更新。 Since this is a rapidly evolving situation, new cases may not be immediately represented visually. Refer to the primary article COVID-19 pandemic or the World Health Organization's situation reports for most recent reported case information. Legend information for older versions: Every country larger than 3 million km² or with a bigger population than 200 million people has been split up into its first level administrative division for better visualization of the spread of the epidemic. > 100 cases per 1,000 inhabitants 30 – 100 cases per 1,000 inhabitants 10 – 30 cases per 1,000 inhabitants 3 – 10 cases per 1,000 inhabitants 1 – 3 cases per 1,000 inhabitants 0.3 – 1 cases per 1,000 inhabitants > 0 – 0.3 cases per 1,000 inhabitants No reported cases, no population, or no data available |
| 날짜 |
2020년 3월 17일 (First version). Date of first upload to the Wikimedia Commons. An upload link is at the end of the file history list. Please upload new versions at least once per week. Update the "point in time" date in the Wikidata entry linked below. {{wikidata|property|Q95963597|P585}} is used in map captions on Wikipedia. It provides the map date. To enable the date change click the purge link after updating the Wikidata entry. |
| 출처 |
Latest versions: https://ourworldindata.org/explorers/coronavirus-data-explorer?tab=map&Metric=Confirmed+cases&Interval=Cumulative&Relative+to+Population=true&Align+outbreaks=false&country=~OWID_WRL - Our World in Data. Click on the download tab to download map. The table tab has a table of the exact data by country. Source tab says data is from the COVID-19 Data Repository by the Center for Systems Science and Engineering (CSSE) at Johns Hopkins University. The map at the source is interactive and provides more detail. For example, run your cursor over the color bar legend to see the countries that apply to that point in the legend. Older versions: 자작
|
| 저자 | Raphaël Dunant, Gajmar (maintainer),幺于 (maintainer) |
| SVG 발전 | 이 SVG 파일의 소스 코드를 3가지의 실수입니다. 이 W3C-무효 벡터 그림은 Other tools(으)로 제작되었습니다. 이 SVG 지도는은 내장된 문자열을 사용하고 있으며 문서 편집기를 사용해서 쉽게 번역할 수 있습니다. |
라이선스
- 이용자는 다음의 권리를 갖습니다:
- 공유 및 이용 – 저작물의 복제, 배포, 전시, 공연 및 공중송신
- 재창작 – 저작물의 개작, 수정, 2차적저작물 창작
- 다음과 같은 조건을 따라야 합니다:
- 저작자표시 – 적절한 저작자 표시를 제공하고, 라이센스에 대한 링크를 제공하고, 변경사항이 있는지를 표시해야 합니다. 당신은 합리적인 방식으로 표시할 수 있지만, 어떤 방식으로든 사용권 허가자가 당신 또는 당신의 사용을 지지하는 방식으로 표시할 수 없습니다.
파일 역사
날짜/시간 링크를 클릭하면 해당 시간의 파일을 볼 수 있습니다.
| 날짜/시간 | 섬네일 | 크기 | 사용자 | 설명 | |
|---|---|---|---|---|---|
| 현재 | 2022년 12월 24일 (토) 14:54 | | 2,921 × 1,500 (2.78 MB) | AKS471883 | update |
| 2022년 12월 7일 (수) 12:34 |  | 2,921 × 1,500 (2.78 MB) | AKS471883 | update | |
| 2022년 11월 20일 (일) 16:58 |  | 2,921 × 1,500 (2.78 MB) | AKS471883 | update | |
| 2022년 8월 31일 (수) 16:54 |  | 2,921 × 1,500 (2.78 MB) | AKS471883 | update | |
| 2022년 8월 30일 (화) 16:40 |  | 2,921 × 1,500 (2.78 MB) | 幺于 | update | |
| 2022년 6월 27일 (월) 16:42 |  | 2,921 × 1,500 (2.78 MB) | 幺于 | update | |
| 2022년 5월 22일 (일) 12:36 |  | 2,921 × 1,500 (2.78 MB) | 幺于 | update | |
| 2022년 5월 22일 (일) 11:52 |  | 2,921 × 1,500 (2.78 MB) | AKS471883 | Update | |
| 2022년 5월 21일 (토) 21:38 |  | 2,921 × 1,500 (2.78 MB) | AKS471883 | update | |
| 2022년 5월 19일 (목) 19:51 |  | 2,921 × 1,500 (2.78 MB) | AKS471883 | Easter Island to Chile |
이 파일을 사용하는 문서
다음 문서 1개가 이 파일을 사용하고 있습니다:
이 파일을 사용하고 있는 모든 위키의 문서 목록
다음 위키에서 이 파일을 사용하고 있습니다:
- af.wikipedia.org에서 이 파일을 사용하고 있는 문서 목록
- ar.wikipedia.org에서 이 파일을 사용하고 있는 문서 목록
- arz.wikipedia.org에서 이 파일을 사용하고 있는 문서 목록
- ast.wikipedia.org에서 이 파일을 사용하고 있는 문서 목록
- as.wikipedia.org에서 이 파일을 사용하고 있는 문서 목록
- awa.wikipedia.org에서 이 파일을 사용하고 있는 문서 목록
- azb.wikipedia.org에서 이 파일을 사용하고 있는 문서 목록
- az.wikipedia.org에서 이 파일을 사용하고 있는 문서 목록
- bg.wikipedia.org에서 이 파일을 사용하고 있는 문서 목록
- bjn.wikipedia.org에서 이 파일을 사용하고 있는 문서 목록
- bn.wikipedia.org에서 이 파일을 사용하고 있는 문서 목록
- bo.wikipedia.org에서 이 파일을 사용하고 있는 문서 목록
- br.wikipedia.org에서 이 파일을 사용하고 있는 문서 목록
- ca.wikipedia.org에서 이 파일을 사용하고 있는 문서 목록
- cs.wikipedia.org에서 이 파일을 사용하고 있는 문서 목록
- dag.wikipedia.org에서 이 파일을 사용하고 있는 문서 목록
- de.wikipedia.org에서 이 파일을 사용하고 있는 문서 목록
- Benutzer:Mapmaster
- COVID-19-Pandemie
- COVID-19-Pandemie in Italien
- COVID-19-Pandemie in Deutschland
- COVID-19-Pandemie in Südkorea
- COVID-19-Pandemie in der Schweiz
- COVID-19-Pandemie in Österreich
- Vorlage:Navigationsleiste COVID-19-Pandemie
- COVID-19-Pandemie in Frankreich
- COVID-19-Pandemie im Iran
- COVID-19-Pandemie in den Vereinigten Staaten
- COVID-19-Pandemie in der Volksrepublik China
- COVID-19-Pandemie in Spanien
- COVID-19-Pandemie in Osttimor
- COVID-19-Pandemie in Norwegen
- COVID-19-Pandemie in Afrika
- COVID-19-Pandemie in Dänemark
- COVID-19-Pandemie in Japan
- COVID-19-Pandemie in Finnland
- COVID-19-Pandemie in Polen
- COVID-19-Pandemie im Königreich der Niederlande
- COVID-19-Pandemie in Vietnam
- COVID-19-Pandemie in San Marino
- COVID-19-Pandemie im Vereinigten Königreich
- COVID-19-Pandemie in Belgien
- COVID-19-Pandemie in Israel
- COVID-19-Pandemie in Liechtenstein
- COVID-19-Pandemie in Indien
- COVID-19-Pandemie in Kanada
- COVID-19-Pandemie in Brasilien
- COVID-19-Pandemie in Portugal
- Benutzer:Triplec85/COVID-19-Pandemie in
이 파일의 더 많은 사용 내역을 봅니다.