파일:Mpl example Helmoltz coils.svg

SVG 파일의 PNG 형식의 미리보기 크기: 540 × 540 픽셀. 다른 해상도: 240 × 240 픽셀 | 480 × 480 픽셀 | 768 × 768 픽셀 | 1,024 × 1,024 픽셀 | 2,048 × 2,048 픽셀
원본 파일 (SVG 파일, 실제 크기 540 × 540 픽셀, 파일 크기: 63 KB)
파일 설명
| 설명 |
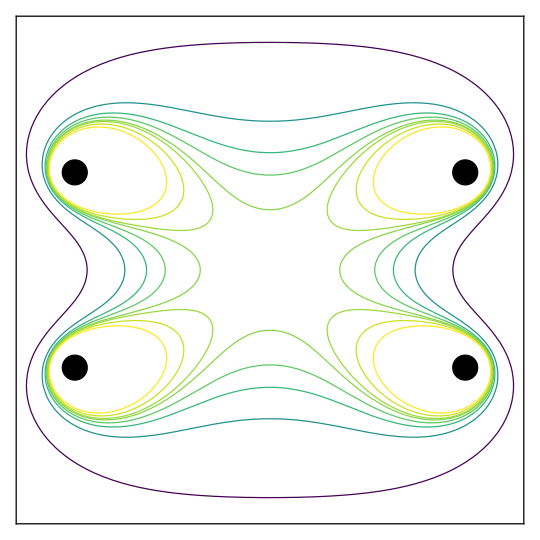
English: Cross section of B (magnetic field strength) magnitude in a Helmholtz coil (actually consisting of two coils: one at the top, one at the bottom in the plot). The eight contours are for field magnitudes of 0.5 {\displaystyle B_0}, 0.8 {\displaystyle B_0}, 0.9 {\displaystyle B_0}, 0.95 {\displaystyle B_0}, 0.99 {\displaystyle B_0}, 1.01 {\displaystyle B_0}, 1.05 {\displaystyle B_0}, and 1.1 {\displaystyle B_0}, where {\displaystyle B_0} is field strength at center. The large center area has almost uniform field strength. |
| 날짜 | |
| 출처 | 자작 |
| 저자 | Adrien F. Vincent |
| SVG 발전 | 이 벡터 그림은 Matplotlib(으)로 제작되었습니다. |
Rationale: this work aims at providing an up-to-date version of the similar work https://commons.wikimedia.org/wiki/File:Helmholtz_coil,_B_magnitude_cross_section.svg, done by Morn.
Source code has been modified into fully object-oriented matplotlib interface. It now uses the "viridis" colormap, instead of "jet" which produces perceptual glitches. Besides, some changes had to be done to work with versions of numpy more recent than the one originally used.
The matplotlib (mpl) version is 1.5.3, with Python 2.7 and numpy 1.10
##########
## Code for the figure
##########
# -*- coding: utf-8 -*-
from __future__ import division

import matplotlib.pyplot as plt
import numpy as np

from matplotlib.cm import viridis as colormap  # future default colormap

"""
Setup
"""
r = 1.0
res = 200  # grid resolution. 100 may be enough, resulting in smaller SVG file)

def dist3(a, b, c, d, e, f):
    """Compute the Euclidian distance from (d, e, f) to (a, b, c),
    raised to the 3rd power (and with lower boundary `r`).
    """
    return np.maximum(r, np.sqrt((a - d)**2 + (b - e)**2 + (c - f)**2))

x = np.linspace(-150, 150, res)
y = np.linspace(-150, 150, res)
X, Y = np.meshgrid(x, y)
F = np.zeros((res, res, 3))

"""
Computing part
"""
# Loop over two coils
for coils in [1.0, -1.0]:
    # Sum field contributions from coil in 10-degree steps
    for p in np.arange(0, 360, 10):
        xc = 100 * np.sin(np.pi * p / 180.0)
        yc = 50 * coils
        zc = 100 * np.cos(np.pi * p / 180.0)
        MAG = 1.0 / ((r + dist3(X, Y, 0.0, xc, yc, zc))**3)
        # (We leave out the necessary constants that would be required
        # to get proper units because only scaling behavior will be shown
        # in the plot. This is also why a sum instead of an integral
        # can be used.)
        #
        # Due to more stringent casting rules in recent Numpy (>=1.10),
        # one builds an explicit list of all the vectors (X - xc, Y - yc, -zc)
        # instead of relying on broadcasting. One then reshapes the array Z
        # (of the cross-product results) as previously expected.
        vectors = np.array([[xval - xc, yval - yc, -zc] for (xval, yval)
                            in zip(X.reshape(-1), Y.reshape(-1))])
        Z = np.cross(vectors, (-zc, 0.0, xc))
        Z = Z.reshape(res, res, 3)
        F += Z * MAG[:,:,np.newaxis]

# Compute the B-field
B = np.sqrt(F[..., 0]**2 + F[..., 1]**2 + F[..., 2]**2)
# Scale field strength by value at center
B = B / B[res // 2, res // 2]

"""
Plotting part
"""
fig_label = "helmoltz_coils"
plt.close(fig_label)
fig, ax = plt.subplots(figsize=(6, 6), num=fig_label, frameon=False)

levels = (0.5, 0.8, 0.9, 0.95, 0.99, 1.01, 1.05, 1.1)
cs = ax.contour(x, y, B, cmap=colormap, levels=levels)

# Add wire symbols
ax.scatter((100, 100, -100, -100), (50, -50, 50, -50), s=400, color="Black")

ax.axis((-130, 130, -130, 130))
ax.set_xticks([])
ax.set_yticks([])

plt.tight_layout()
plt.show()

fig.savefig("Helmholtz_coil,_B_magnitude_cross_section.svg")
##########
라이선스
나는 아래 작품의 저작권자로서, 이 저작물을 다음과 같은 라이선스로 배포합니다:
이 파일은 크리에이티브 커먼즈 저작자표시-동일조건변경허락 4.0 국제 라이선스로 배포됩니다.
- 이용자는 다음의 권리를 갖습니다:
- 공유 및 이용 – 저작물의 복제, 배포, 전시, 공연 및 공중송신
- 재창작 – 저작물의 개작, 수정, 2차적저작물 창작
- 다음과 같은 조건을 따라야 합니다:
- 저작자표시 – 적절한 저작자 표시를 제공하고, 라이센스에 대한 링크를 제공하고, 변경사항이 있는지를 표시해야 합니다. 당신은 합리적인 방식으로 표시할 수 있지만, 어떤 방식으로든 사용권 허가자가 당신 또는 당신의 사용을 지지하는 방식으로 표시할 수 없습니다.
- 동일조건변경허락 – 만약 당신이 이 저작물을 리믹스 또는 변형하거나 이 저작물을 기반으로 제작하는 경우, 당신은 당신의 기여물을 원저작물과 동일하거나 호환 가능한 라이선스에 따라 배포하여야 합니다.
파일 역사
날짜/시간 링크를 클릭하면 해당 시간의 파일을 볼 수 있습니다.
| 날짜/시간 | 섬네일 | 크기 | 사용자 | 설명 | |
|---|---|---|---|---|---|
| 현재 | 2016년 9월 27일 (화) 18:52 | | 540 × 540 (63 KB) | Adrien F. Vincent | User created page with UploadWizard |
이 파일을 사용하는 문서
다음 문서 1개가 이 파일을 사용하고 있습니다:
이 파일을 사용하고 있는 모든 위키의 문서 목록
다음 위키에서 이 파일을 사용하고 있습니다:
- bn.wikipedia.org에서 이 파일을 사용하고 있는 문서 목록
- en.wikipedia.org에서 이 파일을 사용하고 있는 문서 목록
- pt.wikipedia.org에서 이 파일을 사용하고 있는 문서 목록
- tr.wikipedia.org에서 이 파일을 사용하고 있는 문서 목록
- zh.wikipedia.org에서 이 파일을 사용하고 있는 문서 목록