파일:Partial transmittance.gif

Partial_transmittance.gif(367 × 161 픽셀, 파일 크기: 67 KB, MIME 종류: image/gif, 반복됨, 53 프레임, 4.2 s)

파일 설명

설명
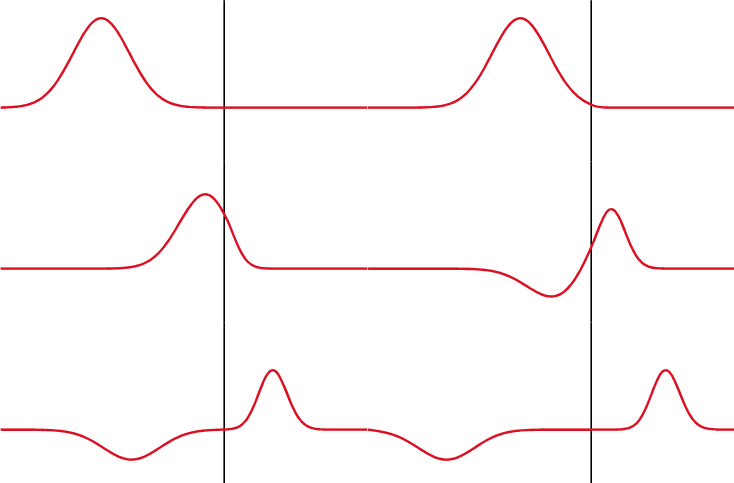
Русский: Показано классическое отражение/прохождение солитона гауссового импульса от/в более плотную среду. В реальности же, свет отражается не от поверхности, а от всех частиц тела (см. ru:КЭД).
English: Illustration of partial reflection of a wave. A gaussian wave on a one-dimensional string strikes a boundary with transmission coefficient of 0.5. Half the wave is transmitted and half is reflected.
Français : Illustration de la réflection partielle d'une onde. Une onde gaussienne se déplaçant sur un ressort unidimensionnel est réfléchie/transmise au niveau d'une interface avec un coefficient de transmission de 0.5.
Español: Ilustración de una reflexión parcial de una onda. Una onda gaussiana sobre una cuerda de una dimensión choca contra un limite con un coeficiente de transmisión de 0.5. La mitad de la onda es transmitida y la otra mitad es reflejada.
날짜
출처 self-made with MATLAB, source code below
저자 Oleg Alexandrov
 
다이어그램MATLAB(으)로 제작되었습니다.

라이선스

Public domain 나는 이 작품의 저작권자로서, 이 작품을 퍼블릭 도메인으로 모두에게 공개합니다. 이 공개 선언은 전 세계적으로 유효합니다.
만약 저작권의 포기가 법률적으로 가능하지 않은 경우,
나는 이 작품을 법적으로 허용되는 한도 내에서 누구나 자유롭게 어떤 목적으로도 제한없이 사용할 수 있도록 허용합니다.

MATLAB source code

% Partial transmittance and reflectance of a wave
% Code is messed up, don't have time to clean it now
function main()
 
   % KSmrq's colors
   red    = [0.867 0.06 0.14];
   blue   = [0, 129, 205]/256;
   green  = [0, 200,  70]/256;
   yellow = [254, 194,   0]/256;
   white = 0.99*[1, 1, 1];
   black = [0, 0, 0];
 
   % length of the string and the grid
   L = 5;
   N = 151;
   X=linspace(0, L, N);
 
   h = X(2)-X(1); % space grid size
   c = 0.01; % speed of the wave
   tau = 0.25*h/c; % time grid size
 
   % form a medium with a discontinuous wave speed
   C = 0*X+c;
 
   D=L/2;
   c_right = 0.5*c; % speed to the right of the disc
   for i=1:N
      if X(i) > D
         C(i) = c_right;
      end
   end
   % Now C = c for x < D, and C=c_right for x > D
 
   K = 5; % steepness of the bump
   S = 0; % shift the wave
   f=inline('exp(-K*(x-S).^2)', 'x', 'S', 'K'); % a gaussian as an initial wave
   df=inline('-2*K*(x-S).*exp(-K*(x-S).^2)', 'x', 'S', 'K'); % derivative of f
 
   % wave at time 0 and tau
   U0 = 0*f(X, S, K);
   U1 = U0 - 2*tau*c*df(X, S, K);
 
   U = 0*U0; % current U
 
   % plot between Start and End
   Start=130; End=500;
 
   % hack to capture the first period of the wave
   min_k = 2*N; k_old = min_k; turn_on = 0; 
 
   frame_no = 0;
   for j=1:End
 
      %  fixed end points
      U(1)=0; U(N)=0;
 
      % finite difference discretization in time
      for i=2:(N-1)
         U(i) = (C(i)*tau/h)^2*(U1(i+1)-2*U1(i)+U1(i-1)) + 2*U1(i) - U0(i);
      end
 
      % update info, for the next iteration
      U0 = U1; U1 = U;
 
      spacing=7;
 
     % plot the wave
      if rem(j, spacing) == 1 & j > Start
 
         figure(1); clf; hold on;
         axis equal; axis off; 
         lw = 3; % linewidth
 
         % size of the window
         ys = 1.2;
 
         low = -0.5*ys;
         high = ys;
         plot([D, D], [low, high], 'color', black, 'linewidth', 0.7*lw)
%         fill([X(1), D, D, X(1)], [low, low, high, high], [0.9, 1, 1], 'edgealpha', 0);
%         fill([D X(N), X(N), D],  [low, low, high, high], [1, 1, 1], 'edgealpha', 0);
 
         plot(X, U, 'color', red, 'linewidth', lw);
 
         % plot the ends of the string
         small_rad = 0.06;
 
         axis([-small_rad, 0.82*L, -ys, ys]);
 
         % small markers to keep the bounding box fixed when saving to eps
         plot(-small_rad, ys, '*', 'color', white);
         plot(L+small_rad, -ys, '*', 'color', white);
 
         pause(0.1)
         frame_no = frame_no + 1;
         %frame=sprintf('Frame%d.eps', 1000+frame_no); saveas(gcf, frame, 'psc2');
         frame=sprintf('Frame%d.png', 1000+frame_no);% saveas(gcf, frame);
         disp(frame)
         print (frame, '-dpng', '-r300');
 
      end
   end
 
 
% The gif image was creating with the command
% convert -antialias -loop 10000  -delay 8 -compress LZW -scale 20% Frame10*png Partial_transmittance.gif
% and was later cropped in Gimp

설명

이 파일이 나타내는 바에 대한 한 줄 설명을 추가합니다

이 파일에 묘사된 항목

다음을 묘사함

파일 역사

날짜/시간 링크를 클릭하면 해당 시간의 파일을 볼 수 있습니다.

날짜/시간섬네일크기사용자설명
현재2010년 4월 10일 (토) 01:362010년 4월 10일 (토) 01:36 판의 섬네일367 × 161 (67 KB)Aiyizooptimized animation
2007년 11월 26일 (월) 14:562007년 11월 26일 (월) 14:56 판의 섬네일367 × 161 (86 KB)Oleg Alexandrov{{Information |Description=Illustration of en:Transmission coefficient (optics) |Source=self-made with MATLAB, source code below |Date=~~~~~ |Author= Oleg Alexandrov |Permission=PD-self, see below |other_versions= }} {{PD-se

다음 문서 2개가 이 파일을 사용하고 있습니다:

이 파일을 사용하고 있는 모든 위키의 문서 목록

다음 위키에서 이 파일을 사용하고 있습니다:

이 파일의 더 많은 사용 내역을 봅니다.