파일:RiemannCriticalLine.svg

SVG 파일의 PNG 형식의 미리보기 크기: 800 × 372 픽셀. 다른 해상도: 320 × 149 픽셀 | 640 × 298 픽셀 | 1,024 × 476 픽셀 | 1,280 × 595 픽셀 | 2,560 × 1,191 픽셀 | 933 × 434 픽셀
원본 파일 (SVG 파일, 실제 크기 933 × 434 픽셀, 파일 크기: 50 KB)
W3C-validity not checked.
파일 설명
| 설명 |
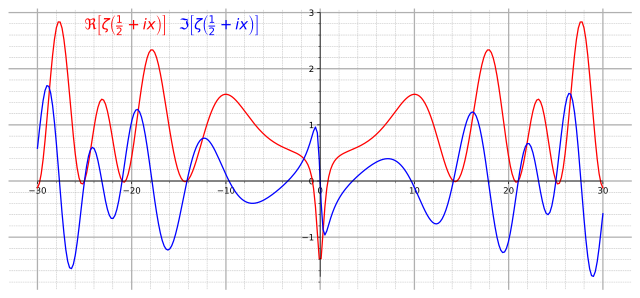
English: Graph of real (red) and imaginary (blue) parts of the critical line Re(z)=1/2 of the Riemann zeta function. |
||
| 날짜 | |||
| 출처 |
Own work. Made with Mathematica using the following code: Show[Plot[{Re[Zeta[1/2+I x]], Im[Zeta[1/2+I x]]}, {x,-30, 30},AxesLabel->{"x"} , PlotStyle->{Red, Blue}, Ticks->{Table[4x-28,{x,0,14}]}, ImageSize->{800,600}],
Graphics[Text[Style[\[DoubleStruckCapitalR][\[Zeta][ I x + "1/2"]],14,Red ,Background ->White],{-22,2.6} ]],
Graphics[Text[Style[\[GothicCapitalI][\[Zeta][ I x + "1/2"]],14,Blue ,Background ->White],{-14,2.6} ]]] |
||
| 저자 | Slonzor | ||
| 저작권 (이 파일을 인용하기) |
Public Domain | ||
| SVG 발전 | |||
| 소스 코드 | Python code
|
라이선스
| 나는 이 작품의 저작권자로서, 이 작품을 퍼블릭 도메인으로 모두에게 공개합니다. 이 공개 선언은 전 세계적으로 유효합니다. 만약 저작권의 포기가 법률적으로 가능하지 않은 경우, 나는 이 작품을 법적으로 허용되는 한도 내에서 누구나 자유롭게 어떤 목적으로도 제한없이 사용할 수 있도록 허용합니다. |
파일 역사
날짜/시간 링크를 클릭하면 해당 시간의 파일을 볼 수 있습니다.
| 날짜/시간 | 섬네일 | 크기 | 사용자 | 설명 | |
|---|---|---|---|---|---|
| 현재 | 2017년 8월 24일 (목) 05:01 | | 933 × 434 (50 KB) | Krishnavedala | much reduced vector version |
| 2009년 9월 25일 (금) 07:28 |  | 800 × 600 (122 KB) | Geek3 | linewidth=1px | |
| 2008년 11월 21일 (금) 04:33 |  | 800 × 600 (122 KB) | Slonzor | Man i've messed this up a lot of times. | |
| 2008년 11월 21일 (금) 04:27 |  | 800 × 600 (3.36 MB) | Slonzor | ||
| 2008년 11월 21일 (금) 04:23 |  | 800 × 600 (3.36 MB) | Slonzor | ||
| 2008년 11월 21일 (금) 04:18 |  | 800 × 600 (3.36 MB) | Slonzor | ||
| 2008년 11월 21일 (금) 04:13 |  | 800 × 600 (79 KB) | Slonzor | {{Information |Description={{en|1=Graph of real (red) and imaginary (blue) parts of the critical line Re(z)=1/2 of the Riemann zeta function.}} |Source=Own work. Made with Mathematica using the following code: <code><nowiki>Show[Plot[{Re[Zeta[1/2+I x]], |
이 파일을 사용하는 문서
다음 문서 1개가 이 파일을 사용하고 있습니다:
이 파일을 사용하고 있는 모든 위키의 문서 목록
다음 위키에서 이 파일을 사용하고 있습니다:
- ar.wikipedia.org에서 이 파일을 사용하고 있는 문서 목록
- ba.wikipedia.org에서 이 파일을 사용하고 있는 문서 목록
- be.wikipedia.org에서 이 파일을 사용하고 있는 문서 목록
- ca.wikipedia.org에서 이 파일을 사용하고 있는 문서 목록
- ckb.wikipedia.org에서 이 파일을 사용하고 있는 문서 목록
- da.wikipedia.org에서 이 파일을 사용하고 있는 문서 목록
- el.wikipedia.org에서 이 파일을 사용하고 있는 문서 목록
- en.wikipedia.org에서 이 파일을 사용하고 있는 문서 목록
- eo.wikipedia.org에서 이 파일을 사용하고 있는 문서 목록
- es.wikipedia.org에서 이 파일을 사용하고 있는 문서 목록
- eu.wikipedia.org에서 이 파일을 사용하고 있는 문서 목록
- fa.wikipedia.org에서 이 파일을 사용하고 있는 문서 목록
- fi.wikipedia.org에서 이 파일을 사용하고 있는 문서 목록
- he.wikipedia.org에서 이 파일을 사용하고 있는 문서 목록
- hi.wikipedia.org에서 이 파일을 사용하고 있는 문서 목록
- hy.wikipedia.org에서 이 파일을 사용하고 있는 문서 목록
- id.wikipedia.org에서 이 파일을 사용하고 있는 문서 목록
- it.wikipedia.org에서 이 파일을 사용하고 있는 문서 목록
- it.wikiquote.org에서 이 파일을 사용하고 있는 문서 목록
- ja.wikipedia.org에서 이 파일을 사용하고 있는 문서 목록
- la.wikipedia.org에서 이 파일을 사용하고 있는 문서 목록
- mn.wikipedia.org에서 이 파일을 사용하고 있는 문서 목록
- nn.wikipedia.org에서 이 파일을 사용하고 있는 문서 목록
- no.wikipedia.org에서 이 파일을 사용하고 있는 문서 목록
- pa.wikipedia.org에서 이 파일을 사용하고 있는 문서 목록
- pt.wikipedia.org에서 이 파일을 사용하고 있는 문서 목록
- ru.wikipedia.org에서 이 파일을 사용하고 있는 문서 목록
- sl.wikipedia.org에서 이 파일을 사용하고 있는 문서 목록
- sq.wikipedia.org에서 이 파일을 사용하고 있는 문서 목록
- sr.wikipedia.org에서 이 파일을 사용하고 있는 문서 목록
- uk.wikipedia.org에서 이 파일을 사용하고 있는 문서 목록
- vi.wikipedia.org에서 이 파일을 사용하고 있는 문서 목록
- zh-yue.wikipedia.org에서 이 파일을 사용하고 있는 문서 목록
이 파일의 더 많은 사용 내역을 봅니다.