파일:Spectral leakage from a sinusoid and rectangular window.png
최대 해상도입니다.
Spectral_leakage_from_a_sinusoid_and_rectangular_window.png (508 × 412 픽셀, 파일 크기: 47 KB, MIME 종류: image/png)
Maksim 사용자가 en.wikipedia에서 공용으로 옮겨왔습니다.
The original description page was here. All following user names refer to en.wikipedia.
파일 설명
| 설명 |
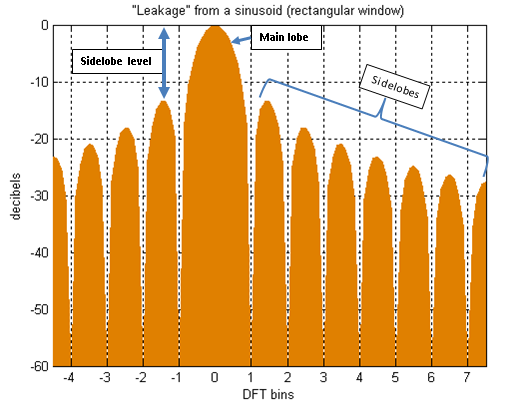
English: This is a portion of the DTFT for a rectangularly-windowed sinusoid. The actual frequency of the sinusoid is indicated as "0" on the horizontal axis. Everything else is leakage. The unit of frequency is "DFT bins"; that is, the integer values on the frequency axis correspond to the frequencies sampled by the DFT. So the figure depicts a case where the actual frequency of the sinusoid happens to coincide with a DFT sample, and the maximum value of the spectrum is accurately measured by that sample. When it misses the maximum value by some amount [up to 1/2 bin], the measurement error is referred to as scalloping loss (inspired by the shape of the peak). But the most interesting thing about this case is that all the other samples coincide with nulls in the true spectrum. (The nulls are actually zero-crossings.) So in this case, the DFT creates the illusion of no leakage. |
|||
| 날짜 | ||||
| 출처 | 자작 I created this image myself, using Matlab tools and PowerPoint to annotate the graph and create a png file. | |||
| 저자 | Bob K | |||
| 저작권 (이 파일을 인용하기) |
|
|||
| 다른 버전 |
|
|||
| Script | Matlab codeN=128;
k=0:N-1;
dr = 60;
w = ones(1,N);
%
H = abs(fft([w zeros(1,7*N)]));
H = fftshift(H);
H = H/max(H);
H = 20*log10(H);
H = max(-dr,H);
x = -4.5*8 : 7.5*8;
H = H(x + 1+4*N);
%
figure
h = area(x/8,H,'FaceColor', [.871 .49 0], 'Linestyle', 'none')
set(h,'BaseValue',-dr)
ylim([-dr 0])
set(gca,'XTick', -4:7)
grid on
ylabel('decibels')
xlabel('DFT bins')
title('"Leakage" from a sinusoid (rectangular window)')
|


|
이 그림, 혹은 이 분류의 그림에는 특정 언어로 된 설명이 붙어 있습니다. 이러한 그림을 언어 중립적인 그림으로 변환하면 다른 언어 프로젝트에서도 사용할 수 있습니다.
|
| date/time | username | edit summary |
|---|---|---|
| 01:47, 17 December 2005 | en:User:Bob K | (I created this image myself, using Matlab tools.) |
파일 역사
날짜/시간 링크를 클릭하면 해당 시간의 파일을 볼 수 있습니다.
| 날짜/시간 | 섬네일 | 크기 | 사용자 | 설명 | |
|---|---|---|---|---|---|
| 현재 | 2011년 12월 17일 (토) 14:25 | | 508 × 412 (47 KB) | Bob K | Remove gray border. Annotate sidelobes, main lobe, sidelobe level. |
| 2006년 3월 21일 (화) 05:04 |  | 514 × 421 (6 KB) | Maksim | La bildo estas kopiita de wikipedia:en. La originala priskribo estas: == Summary == I created this image myself, using Matlab tools. == Licensing == {{PD-self}} {| border="1" ! date/time || username || edit summary |---- | 01:47, 17 December 2005 || [[: |
이 파일을 사용하는 문서
다음 문서 1개가 이 파일을 사용하고 있습니다:
이 파일을 사용하고 있는 모든 위키의 문서 목록
다음 위키에서 이 파일을 사용하고 있습니다:
- es.wikipedia.org에서 이 파일을 사용하고 있는 문서 목록
- fa.wikipedia.org에서 이 파일을 사용하고 있는 문서 목록
- hr.wikipedia.org에서 이 파일을 사용하고 있는 문서 목록
- ja.wikipedia.org에서 이 파일을 사용하고 있는 문서 목록