파일:Vostok Petit data.svg

원본 파일 (SVG 파일, 실제 크기 1,024 × 768 픽셀, 파일 크기: 81 KB)
파일 설명
| 설명 |
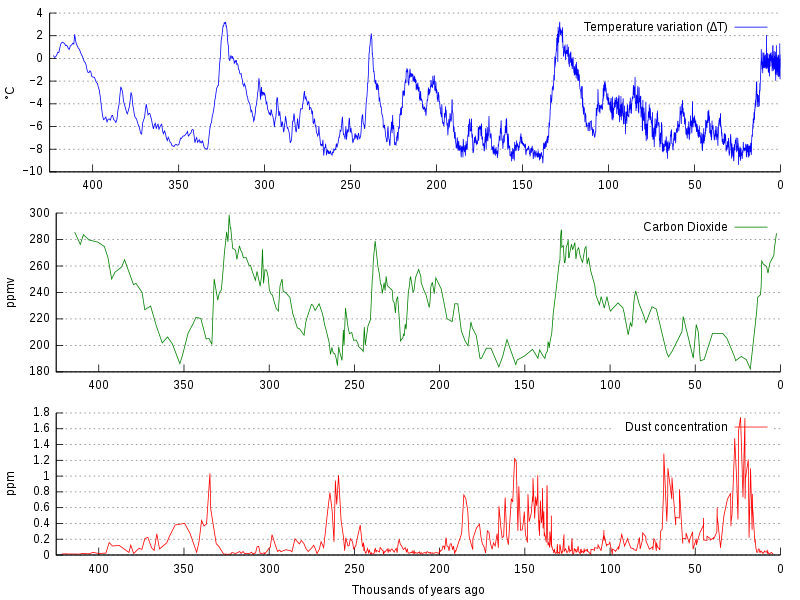
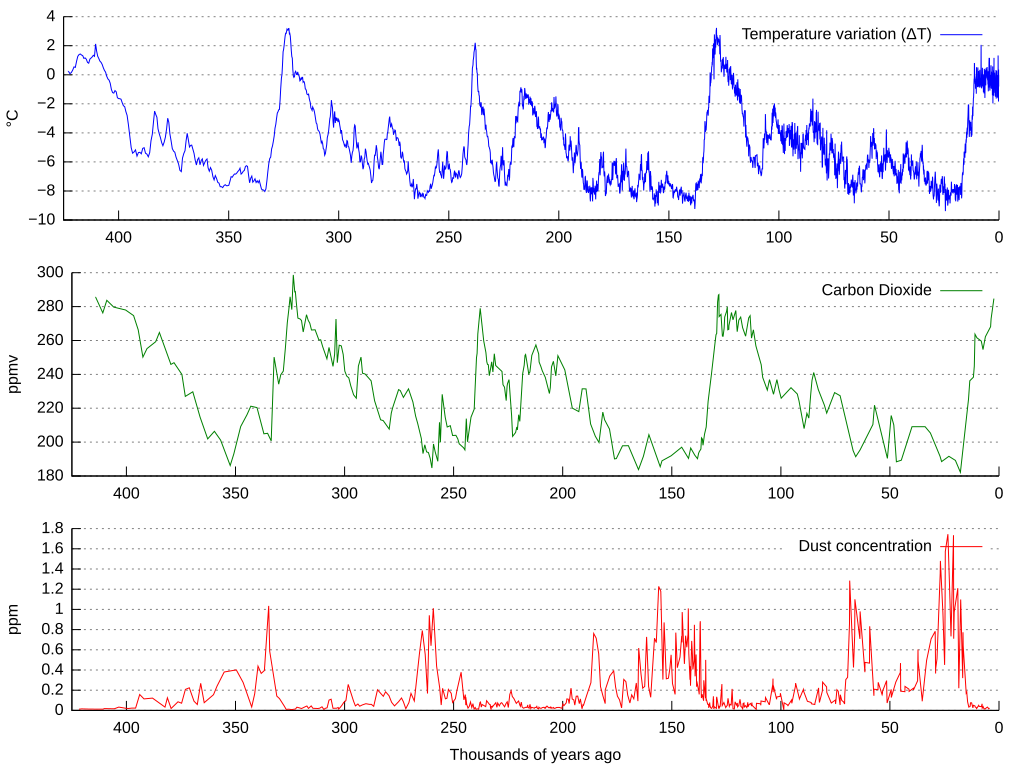
La bildo estas kopiita de wikipedia:en. La originala priskribo estas: Graph of CO2 (Green graph), temperature (Blue graph), and dust concentration (Red graph) measured from the Vostok, Antarctica ice core as reported by Petit et al., 1999. Higher dust levels are believed to be caused by cold, dry periods. The Earth's orbital eccentricity, tilt, and precession vary in a pattern over thousands of years. The IPCC notes that Milankovitch cycles drove the ice age cycles; CO2 followed temperature change "with a lag of some hundreds of years" (visible on a graph more zoomed in than this); and that as a feedback amplified temperature change. Among other factors, CO2 is more soluble in colder than in warmer waters. العربية: مخطّطٌ يُبيّن علاقة ثاني أوكسيد الكاربون ودرجة الحرارة وتركيز الغبار في قالب جليد فوستوك (بالإنجليزيّة: Vostok ice core) خلال 450,000 سنة الماضيّة |
| 날짜 | |
| 출처 | 다음을 기초로 한 자작: Vostok-ice-core-petit.png by NOAA |
| 저자 |
원본: 미상 벡터: |
| 다른 버전 |
이 파일은 다음으로 파생됨: |
| SVG 발전 | 이 SVG 파일은 SVG의 <switch> 요소를 사용하는 것으로 번역되어 있습니다: 모든 번역은 동일 파일 안에 저장되어 있습니다. |
Data sets used are:
- ftp://ftp.ncdc.noaa.gov/pub/data/paleo/icecore/antarctica/vostok/deutnat.txt
- ftp://ftp.ncdc.noaa.gov/pub/data/paleo/icecore/antarctica/vostok/co2nat.txt
- ftp://ftp.ncdc.noaa.gov/pub/data/paleo/icecore/antarctica/vostok/dustnat.txt
소스 코드
Gnuplot code
unset multiplot
set term svg size 1024,768
set output "vostok-data.svg"

set border 3
set xtics nomirror
set ytics nomirror
unset xlabel
unset ylabel

set grid y
set multiplot layout 3,1

set ylabel "°C"
plot [-425:0] [-10:4] \
        "deutnat.txt" \
        using (-$2/1000):4 \
        title "Temperature variation (ΔT)" \
        ls 3 \
        with lines

set ylabel "ppmv"
plot [-425:0] \
        "co2nat.txt" \
        using (-$1/1000):2 \
        title "Carbon Dioxide" \
        ls 2 \
        with lines

set xlabel "Thousands of years ago"
set ylabel "ppm"
plot [-425:0] \
        "dustnat.txt" \
        using (-$1/1000):2 \
        title "Dust concentration" \
        ls 1 \
        with lines
Explanation
After executing gnuplot, the resulting SVG file was manually changed to
* remove the negative signs for the x axis values
* change the [[:w:hyphen-minus|hyphen-minus]] characters in the temperature axis values to proper minus sign characters
| 이 파일은 크리에이티브 커먼즈 저작자표시-동일조건변경허락 3.0 Unported 라이선스로 배포됩니다. | ||
| ||
| 이 라이선스 틀은 GFDL 라이선스 변경의 일부로 이 파일에 추가되었습니다. |

|
GNU 자유 문서 사용 허가서 1.2판 또는 자유 소프트웨어 재단에서 발행한 이후 판의 규정에 따라 본 문서를 복제하거나 개작 및 배포할 수 있습니다. 본 문서에는 변경 불가 부분이 없으며, 앞 표지 구절과 뒷 표지 구절도 없습니다. 본 사용 허가서의 전체 내용은 GNU 자유 문서 사용 허가서 부분에 포함되어 있습니다. |
기존 올리기 기록
This image is a derivative work of the following images:
- Vostok-ice-core-petit.png licensed with Cc-by-sa-3.0-migrated, GFDL
- 2006-02-15T20:38:10Z Maksim 598x441 (31557 Bytes) La bildo estas kopiita de wikipedia:en. La originala priskribo estas: Graph of [[carbon dioxide|CO2]], [[temperature]], and dust concentration measured from the [[Vostok, Antarctica]] [[ice core]] as reported by Petit et al.
Uploaded with derivativeFX
파일 역사
날짜/시간 링크를 클릭하면 해당 시간의 파일을 볼 수 있습니다.
| 날짜/시간 | 섬네일 | 크기 | 사용자 | 설명 | |
|---|---|---|---|---|---|
| 현재 | 2021년 6월 25일 (금) 22:01 | | 1,024 × 768 (81 KB) | Matěj Orlický | File uploaded using svgtranslate tool (https://svgtranslate.toolforge.org/). Added translation for cs. |
| 2013년 12월 1일 (일) 07:25 |  | 1,024 × 768 (77 KB) | SeL media | time axis reversed | |
| 2011년 9월 26일 (월) 02:39 |  | 1,024 × 768 (309 KB) | Hel-hama | text improved | |
| 2011년 4월 27일 (수) 12:07 |  | 1,024 × 768 (83 KB) | Awickert | Didn't realize that it was a draw-on box instead of a measuring-box. Take 3! | |
| 2011년 4월 27일 (수) 12:05 |  | 1,024 × 768 (83 KB) | Awickert | [Shoot - last time, picked original instead of new version to upload] Manually moved axes in Inkscape such that the three plots line up with one another | |
| 2011년 4월 27일 (수) 12:02 |  | 1,024 × 768 (75 KB) | Awickert | Manually moved axes in Inkscape such that the three plots line up with one another | |
| 2010년 6월 20일 (일) 22:25 |  | 1,024 × 768 (75 KB) | Autopilot | {{Information |Description=La bildo estas kopiita de wikipedia:en. La originala priskribo estas: Graph of CO<sub>2</sub> (Green graph), temperature (Blue graph), and dust concentration (Red graph) measured from the [[Vostok, Antarc |
이 파일을 사용하는 문서
다음 문서 1개가 이 파일을 사용하고 있습니다:
이 파일을 사용하고 있는 모든 위키의 문서 목록
다음 위키에서 이 파일을 사용하고 있습니다:
- af.wikipedia.org에서 이 파일을 사용하고 있는 문서 목록
- ar.wikipedia.org에서 이 파일을 사용하고 있는 문서 목록
- be.wikipedia.org에서 이 파일을 사용하고 있는 문서 목록
- bg.wikipedia.org에서 이 파일을 사용하고 있는 문서 목록
- ca.wikipedia.org에서 이 파일을 사용하고 있는 문서 목록
- cs.wikipedia.org에서 이 파일을 사용하고 있는 문서 목록
- cy.wikipedia.org에서 이 파일을 사용하고 있는 문서 목록
- da.wikipedia.org에서 이 파일을 사용하고 있는 문서 목록
- de.wikipedia.org에서 이 파일을 사용하고 있는 문서 목록
- en.wikipedia.org에서 이 파일을 사용하고 있는 문서 목록
- Climate variability and change
- Global cooling
- Ice core
- Orbital forcing
- Quaternary glaciation
- Carbon dioxide in Earth's atmosphere
- Talk:Ice age/Archive 1
- File talk:Vostok Petit data.svg
- List of periods and events in climate history
- User talk:Jc-S0CO/Archives/2013/2
- User:Mark Buchanan/sandbox/QuatGlac
- User:Mark Buchanan/sandbox/Glaciation-WIP
- Portal:Climate change
- Talk:Climate variability and change/Archive 8
- en.wikiversity.org에서 이 파일을 사용하고 있는 문서 목록
- es.wikipedia.org에서 이 파일을 사용하고 있는 문서 목록
- eu.wikipedia.org에서 이 파일을 사용하고 있는 문서 목록
- fa.wikipedia.org에서 이 파일을 사용하고 있는 문서 목록
- fi.wikipedia.org에서 이 파일을 사용하고 있는 문서 목록
- fi.wikiversity.org에서 이 파일을 사용하고 있는 문서 목록
- fr.wikipedia.org에서 이 파일을 사용하고 있는 문서 목록
- gl.wikipedia.org에서 이 파일을 사용하고 있는 문서 목록
- ha.wikipedia.org에서 이 파일을 사용하고 있는 문서 목록
- he.wikipedia.org에서 이 파일을 사용하고 있는 문서 목록
- it.wikipedia.org에서 이 파일을 사용하고 있는 문서 목록
- ja.wikipedia.org에서 이 파일을 사용하고 있는 문서 목록
이 파일의 더 많은 사용 내역을 봅니다.