파일:Beta distribution cdf.svg

SVG 파일의 PNG 형식의 미리보기 크기: 566 × 425 픽셀. 다른 해상도: 320 × 240 픽셀 | 639 × 480 픽셀 | 1,023 × 768 픽셀 | 1,280 × 961 픽셀 | 2,560 × 1,922 픽셀
원본 파일 (SVG 파일, 실제 크기 566 × 425 픽셀, 파일 크기: 80 KB)
파일 설명
| 설명 |
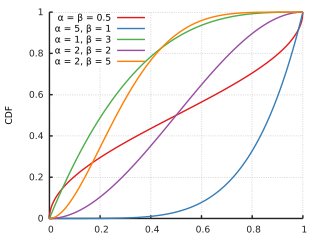
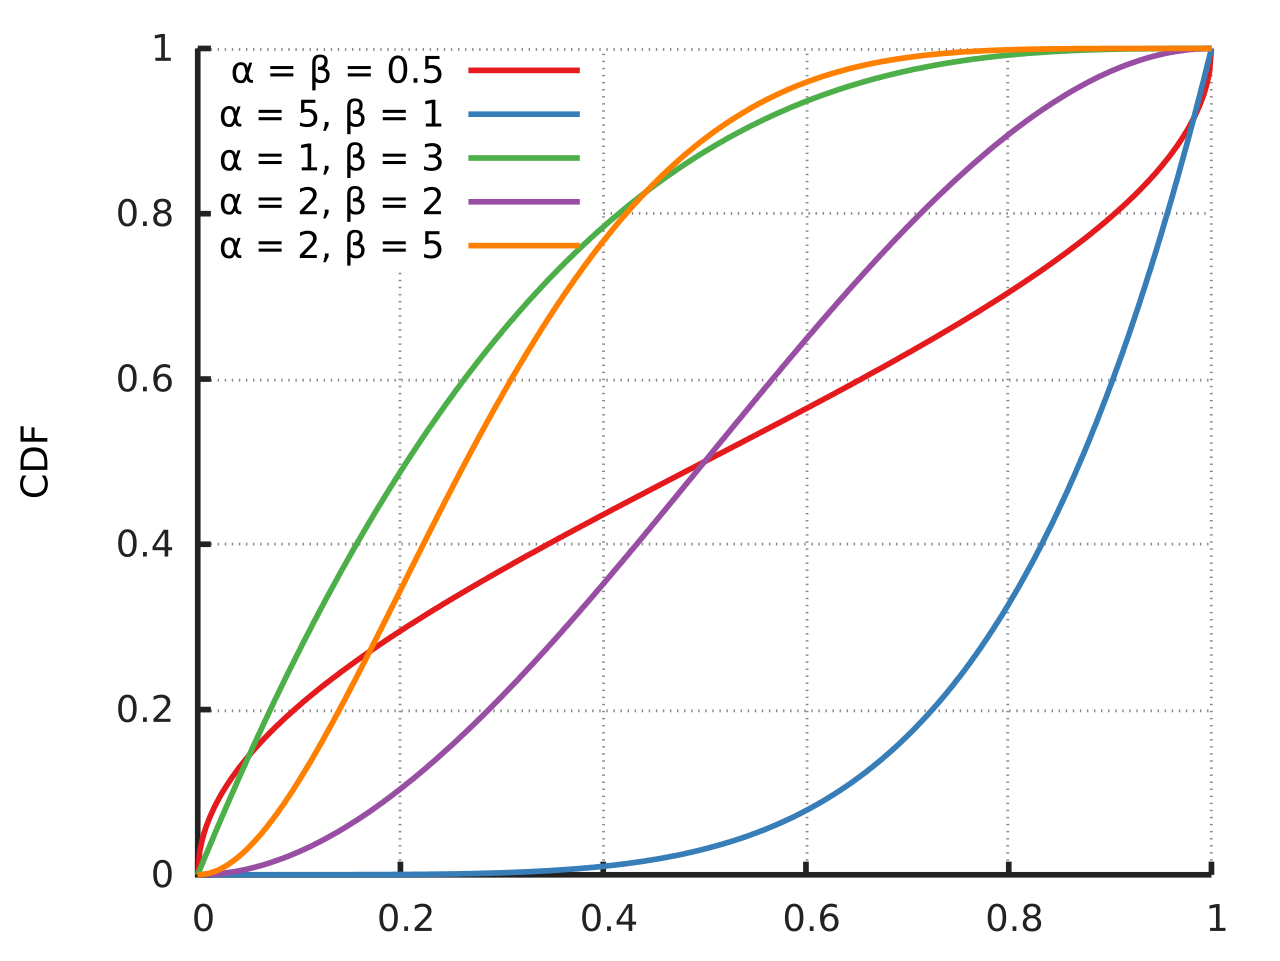
English: Cumulative distribution function for the Beta distribution. |
| 날짜 | |
| 출처 | 자작 |
| 저자 | Horas (토론) based on the work of Krishnavedala |
| 다른 버전 | File:Beta_distribution_cdf.png |
W3C-validity not checked.
Source Codes
| Using gnuplot |
|---|
reset
reset session

out=2
outputpath= "./"
outputfilename="betacummulative"
if(out==1) {
	set terminal qt size 1000,750 font ",14"
}
if(out==2) {
	set terminal pdfcairo size 16cm,12cm  font ",20" linewidth 2
	set output outputpath.outputfilename.".pdf"
}
if(out==3) {
	set terminal pngcairo size 800,600  font ",14"
	set output  outputpath.outputfilename.".png"
}

dbeta(x,a,b) = exp((a-1)*log(x)+(b-1)*log(1-x)-lgamma(a)-lgamma(b)+lgamma(a+b))
pbeta(x,a,b) = ibeta(a,b,x)
f(x,y,z) = pbeta(x,y,z)

set samples 500

set xrange [0:1]
set xtics 0.2
set yrange [0:1]
set ytics 0.2

#set xlabel "x"
set ylabel "CDF"

set key at .40,1

set grid xtics ytics mytics lw 1 lc rgb "#888888" dashtype 3 lt 1
set border 3 back lw 2 lc rgb "#222222"
set tics in nomirror scale 0.75

lww=2
set ls 1 lw lww lc rgb "#e41a1c"
set ls 2 lw lww lc rgb "#377eb8"
set ls 3 lw lww lc rgb "#4daf4a"
set ls 4 lw lww lc rgb "#984ea3"
set ls 5 lw lww lc rgb "#ff7f00"

plot \
    f(x, 0.5,0.5) w l ls 1	title "{/Symbol a} = {/Symbol b} = 0.5", \
    f(x, 5,  1)   w l ls 2	title "{/Symbol a} = 5, {/Symbol b} = 1", \
    f(x, 1,  3)   w l ls 3	title "{/Symbol a} = 1, {/Symbol b} = 3", \
    f(x, 2,  2)   w l ls 4	title "{/Symbol a} = 2, {/Symbol b} = 2", \
    f(x, 2,  5)   w l ls 5	title "{/Symbol a} = 2, {/Symbol b} = 5"

if (out>1) {
	set output
}
if (out == 1) {
	pause -1
}
|
| Using python with matplotlib, scipy and numpy toolboxes. |
|---|
from matplotlib.pyplot import *
from numpy import linspace
from scipy.stats import beta

x = linspace(0,1,75)

fig = figure()
ax = fig.add_subplot(111)
ax.plot(x,beta.cdf(x,0.5,0.5),label=r"$\alpha=\beta=0.5$")
ax.plot(x,beta.cdf(x,5,1),label=r"$\alpha=5, \beta=1$")
ax.plot(x,beta.cdf(x,1,3),label=r"$\alpha=1, \beta=3$")
ax.plot(x,beta.cdf(x,2,2),label=r"$\alpha=2, \beta=2$")
ax.plot(x,beta.cdf(x,2,5),label=r"$\alpha=2, \beta=5$")
ax.grid(True)
ax.minorticks_on()
ax.legend(loc=9)
setp(ax.get_legend().get_texts(),fontsize='small')
ax.set_ylim(0,2.6)
ax.set_xlabel("x")
ax.set_ylabel("PDF")

fig.savefig("Beta_distribution_cdf.svg",bbox_inches="tight",\
	pad_inches=.15)
|
라이선스
| 이 저작물은 완전히 공공의 재산으로서의 정보로만 구성되어 있으며, 창작성이 있는 요소가 포함되어 있지 않아 저작권 보호에 부적격하므로 퍼블릭 도메인입니다. |
파일 역사
날짜/시간 링크를 클릭하면 해당 시간의 파일을 볼 수 있습니다.
| 날짜/시간 | 섬네일 | 크기 | 사용자 | 설명 | |
|---|---|---|---|---|---|
| 현재 | 2014년 11월 15일 (토) 03:50 | | 566 × 425 (80 KB) | Horas | {{Information |Description=edited to fit to prob. density function plot. Better readability. |Date=2014-11-14 |Source={{own}} |Author= ~~~ |Permission= |other_versions= }} |
| 2011년 6월 5일 (일) 06:56 |  | 640 × 495 (65 KB) | Krishnavedala | corrected the y-axis label and location of legend | |
| 2011년 6월 5일 (일) 06:54 |  | 639 × 495 (65 KB) | Krishnavedala | corrected the range of y-axis | |
| 2011년 6월 5일 (일) 06:53 |  | 639 × 489 (68 KB) | Krishnavedala | {{Information |Description ={{en|1=Cumulative distribution function for the Beta distribution. Created using python with matplotlib, scipy and numpy toolboxes. <syntaxhighligh |
이 파일을 사용하는 문서
다음 문서 1개가 이 파일을 사용하고 있습니다:
이 파일을 사용하고 있는 모든 위키의 문서 목록
다음 위키에서 이 파일을 사용하고 있습니다:
- be.wikipedia.org에서 이 파일을 사용하고 있는 문서 목록
- ca.wikipedia.org에서 이 파일을 사용하고 있는 문서 목록
- de.wikipedia.org에서 이 파일을 사용하고 있는 문서 목록
- en.wikipedia.org에서 이 파일을 사용하고 있는 문서 목록
- en.wikibooks.org에서 이 파일을 사용하고 있는 문서 목록
- fi.wikipedia.org에서 이 파일을 사용하고 있는 문서 목록
- he.wikipedia.org에서 이 파일을 사용하고 있는 문서 목록
- it.wikipedia.org에서 이 파일을 사용하고 있는 문서 목록
- ja.wikipedia.org에서 이 파일을 사용하고 있는 문서 목록
- pt.wikipedia.org에서 이 파일을 사용하고 있는 문서 목록
- tl.wikipedia.org에서 이 파일을 사용하고 있는 문서 목록
- tr.wikipedia.org에서 이 파일을 사용하고 있는 문서 목록
- uk.wikipedia.org에서 이 파일을 사용하고 있는 문서 목록
- zh.wikipedia.org에서 이 파일을 사용하고 있는 문서 목록