파일:Beta distribution pdf.svg

SVG 파일의 PNG 형식의 미리보기 크기: 531 × 425 픽셀. 다른 해상도: 300 × 240 픽셀 | 600 × 480 픽셀 | 960 × 768 픽셀 | 1,280 × 1,024 픽셀 | 2,559 × 2,048 픽셀
원본 파일 (SVG 파일, 실제 크기 531 × 425 픽셀, 파일 크기: 80 KB)
파일 설명
| 설명 |
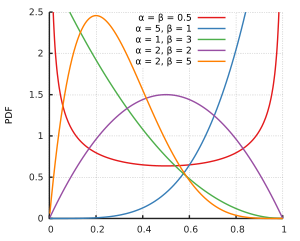
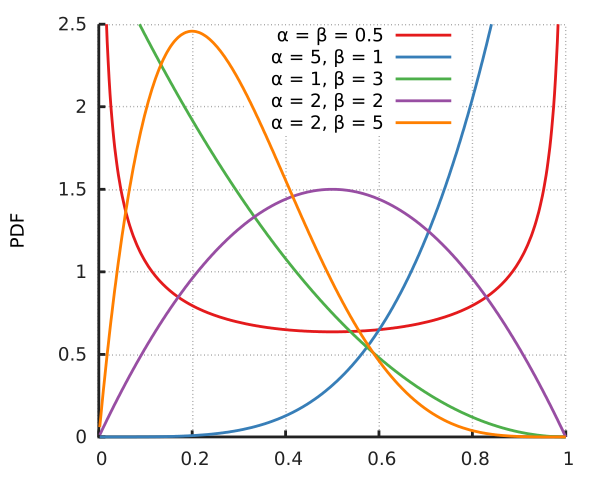
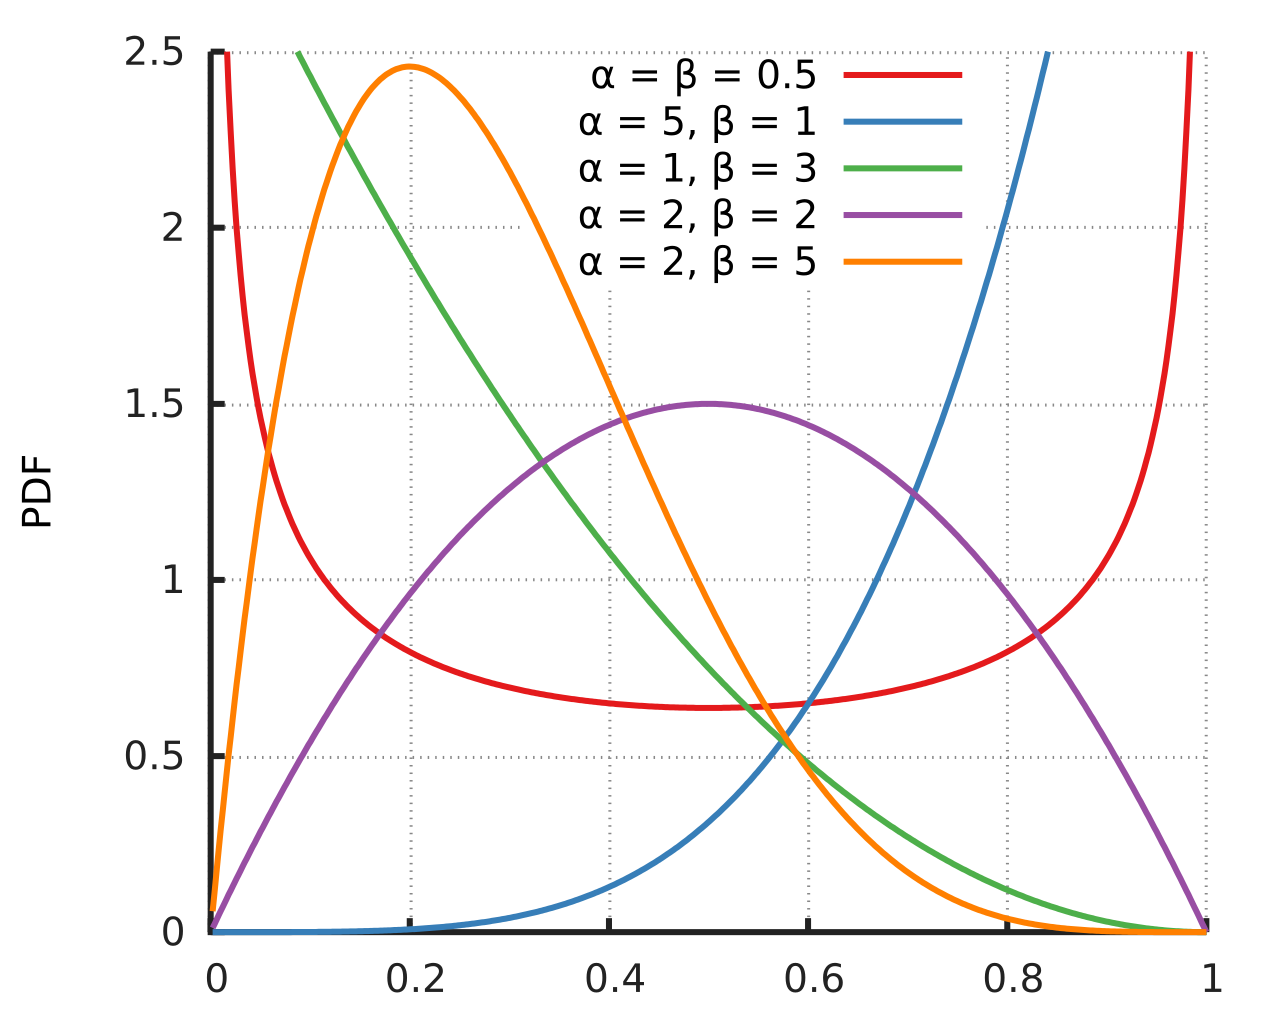
English: Probability density function for the Beta distribution. Created using Gnuplot. |
||||
| 날짜 | |||||
| 출처 | 자작 | ||||
| 저자 | Horas based on the work of Krishnavedala | ||||
| 다른 버전 | File:Beta_distribution_pdf.png | ||||
| SVG 발전 | |||||
| 소스 코드 | Gnuplot code
Data
|
라이선스
| 이 저작물은 완전히 공공의 재산으로서의 정보로만 구성되어 있으며, 창작성이 있는 요소가 포함되어 있지 않아 저작권 보호에 부적격하므로 퍼블릭 도메인입니다. |
파일 역사
날짜/시간 링크를 클릭하면 해당 시간의 파일을 볼 수 있습니다.
| 날짜/시간 | 섬네일 | 크기 | 사용자 | 설명 | |
|---|---|---|---|---|---|
| 현재 | 2014년 11월 14일 (금) 22:10 | | 531 × 425 (80 KB) | Horas | {{Information |Description={{en|1=Probability density function for the Beta distribution. Created using the following code: reset reset session out=2 outputpath= "./" outputfilename="betadistribution" if(out==1) {... |
| 2011년 6월 5일 (일) 06:45 |  | 639 × 489 (68 KB) | Krishnavedala | {{Information |Description ={{en|1=Probability density function for the Beta distribution. Created using python with matplotlib, scipy and numpy toolboxes. <syntaxhighlight lang=" |
이 파일을 사용하는 문서
다음 문서 1개가 이 파일을 사용하고 있습니다:
이 파일을 사용하고 있는 모든 위키의 문서 목록
다음 위키에서 이 파일을 사용하고 있습니다:
- be.wikipedia.org에서 이 파일을 사용하고 있는 문서 목록
- ca.wikipedia.org에서 이 파일을 사용하고 있는 문서 목록
- de.wikipedia.org에서 이 파일을 사용하고 있는 문서 목록
- en.wikipedia.org에서 이 파일을 사용하고 있는 문서 목록
- en.wikibooks.org에서 이 파일을 사용하고 있는 문서 목록
- en.wiktionary.org에서 이 파일을 사용하고 있는 문서 목록
- fi.wikipedia.org에서 이 파일을 사용하고 있는 문서 목록
- he.wikipedia.org에서 이 파일을 사용하고 있는 문서 목록
- it.wikipedia.org에서 이 파일을 사용하고 있는 문서 목록
- ja.wikipedia.org에서 이 파일을 사용하고 있는 문서 목록
- pt.wikipedia.org에서 이 파일을 사용하고 있는 문서 목록
- tl.wikipedia.org에서 이 파일을 사용하고 있는 문서 목록
- tr.wikipedia.org에서 이 파일을 사용하고 있는 문서 목록
- uk.wikipedia.org에서 이 파일을 사용하고 있는 문서 목록
- zh.wikipedia.org에서 이 파일을 사용하고 있는 문서 목록