파일:Helmholtz solution.png

미리 보기 크기: 298 × 598 픽셀 다른 해상도: 119 × 240 픽셀 | 239 × 480 픽셀 | 975 × 1,957 픽셀
원본 파일 (975 × 1,957 픽셀, 파일 크기: 23 KB, MIME 종류: image/png)
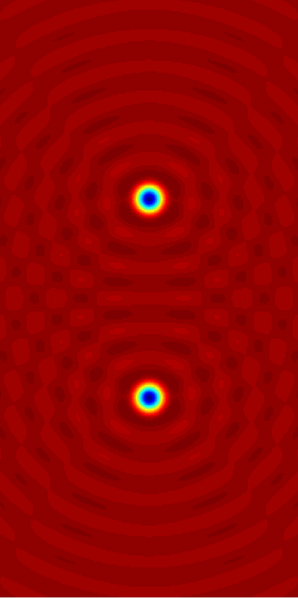
| 설명 | Illustration of en:Helmholtz equation. |
| 날짜 | (UTC) |
| 출처 | self-made with en:Matlab. See the source code below. |
| 저자 | Oleg Alexandrov |
| 나는 이 작품의 저작권자로서, 이 작품을 퍼블릭 도메인으로 모두에게 공개합니다. 이 공개 선언은 전 세계적으로 유효합니다. 만약 저작권의 포기가 법률적으로 가능하지 않은 경우, 나는 이 작품을 법적으로 허용되는 한도 내에서 누구나 자유롭게 어떤 목적으로도 제한없이 사용할 수 있도록 허용합니다. |
Source code (MATLAB)
% Plot the solution to the Helmholtz equation with a given source
clear all;

Box_x = 3;
Scale = 0.5;
Box_y = Box_x/Scale;

Nx = 200;
Ny = Nx/Scale;

wavenumber = 10;

XX = linspace(-Box_x, Box_x, Nx);
YY = linspace(-Box_y, Box_y, Ny);
hx = XX(2) - XX(1);
hy = YY(2) - YY(1);
[X, Y] = meshgrid(XX, YY);

Source_size  = 0.5;
Source_shift = 2;
Source =  max(Source_size^2 - X.^2-(Y-Source_shift).^2, 0) + max(Source_size^2 - X.^2-(Y+Source_shift).^2, 0) ;

% plot the source
figure(1); clf; hold on; axis equal; axis off;
imagesc(Source);


% plot the solution to the Helmholtz equation
I = sqrt(-1);
Field = 0*X;

[m, n] = size(Source);
for i=1:m
   i
   for j=1:n

      if Source(i, j) ~= 0

	 x0 = X(i, j);
	 y0 = Y(i, j);

	 % add the contribution from the current source
	 Field = Field + (I/4)*besselh(0, 1, wavenumber*sqrt((X-x0).^2+(Y-y0).^2) + eps)*Source(i, j)*hx*hy;
      end

   end
end


figure(2); clf; hold on; axis equal; axis off;
imagesc(real(Field));

% Save to disk and convert to png right away
figure(1);
saveas(gcf, 'Helmholtz_source.eps', 'psc2');
%! convert -density 200 Helmholtz_source.eps Helmholtz_source.png

figure(2);
saveas(gcf, 'Helmholtz_solution.eps', 'psc2');
%! convert -density 200 Helmholtz_solution.eps Helmholtz_solution.png

|
이 그림 파일은 벡터 SVG 형식으로 다시 만들어야 합니다. SVG의 장점에 대해서는 여기(영어)를 참고해 주십시오. 만약 이 그림의 SVG 버전이 이미 존재한다면 이 틀을 {{vector version available|새 파일 이름.svg}}으로 대체해 주십시오.
|
파일 역사
날짜/시간 링크를 클릭하면 해당 시간의 파일을 볼 수 있습니다.
| 날짜/시간 | 섬네일 | 크기 | 사용자 | 설명 | |
|---|---|---|---|---|---|
| 현재 | 2007년 7월 8일 (일) 04:50 | | 975 × 1,957 (23 KB) | Oleg Alexandrov | Tweak |
| 2007년 7월 7일 (토) 13:18 |  | 500 × 989 (22 KB) | Oleg Alexandrov | Higher res. | |
| 2007년 7월 7일 (토) 12:59 |  | 500 × 989 (15 KB) | Oleg Alexandrov | {{Information |Description=Illustration of en:Helmholtz equation. |Source=self-made with en:Matlab. See the source code below. |Date=03:56, 7 July 2007 (UTC) |Author= Oleg Alexandrov }} {{PD-self}} ==MATLAB source code |
이 파일을 사용하는 문서
다음 문서 1개가 이 파일을 사용하고 있습니다:
이 파일을 사용하고 있는 모든 위키의 문서 목록
다음 위키에서 이 파일을 사용하고 있습니다:
- ar.wikipedia.org에서 이 파일을 사용하고 있는 문서 목록
- ca.wikipedia.org에서 이 파일을 사용하고 있는 문서 목록
- en.wikipedia.org에서 이 파일을 사용하고 있는 문서 목록
- et.wikipedia.org에서 이 파일을 사용하고 있는 문서 목록
- fa.wikipedia.org에서 이 파일을 사용하고 있는 문서 목록
- fr.wikipedia.org에서 이 파일을 사용하고 있는 문서 목록
- no.wikipedia.org에서 이 파일을 사용하고 있는 문서 목록
- pt.wikipedia.org에서 이 파일을 사용하고 있는 문서 목록
- sq.wikipedia.org에서 이 파일을 사용하고 있는 문서 목록
- vi.wikipedia.org에서 이 파일을 사용하고 있는 문서 목록
- www.wikidata.org에서 이 파일을 사용하고 있는 문서 목록
- zh.wikipedia.org에서 이 파일을 사용하고 있는 문서 목록